Anchoring Bias in Options Trading: Identifying and Overcoming Its Impact on Decision-Making in Indian F&O Markets
When we look at the market, we often latch onto a single number or level and treat it as the ultimate reference point. This mental shortcut, known as anchoring bias, can shape our perception of support and resistance, influence how we interpret option data, and ultimately sway our trading decisions. In this article we’ll break the concept down in plain terms, walk through a simple hypothetical example on NIFTY, show how to spot the bias, and outline practical ways to keep it from clouding your judgment.
What is Anchoring Bias?
Anchoring bias occurs when a trader gives disproportionate weight to an initial piece of information—the “anchor”—and then adjusts insufficiently from that point. In the context of Indian F&O markets, the anchor might be a past price level, a VWAP from a particular day, or a strike price that has attracted a lot of open interest. Once the anchor is set, any new data is evaluated against it, which can lead to skewed expectations about future price movements.
Figure 1 below illustrates a simple price path on NIFTY, highlighting a support zone that many traders might use as an anchor. Notice how the series dips into the zone and then rebounds, reinforcing the idea that the zone is significant.
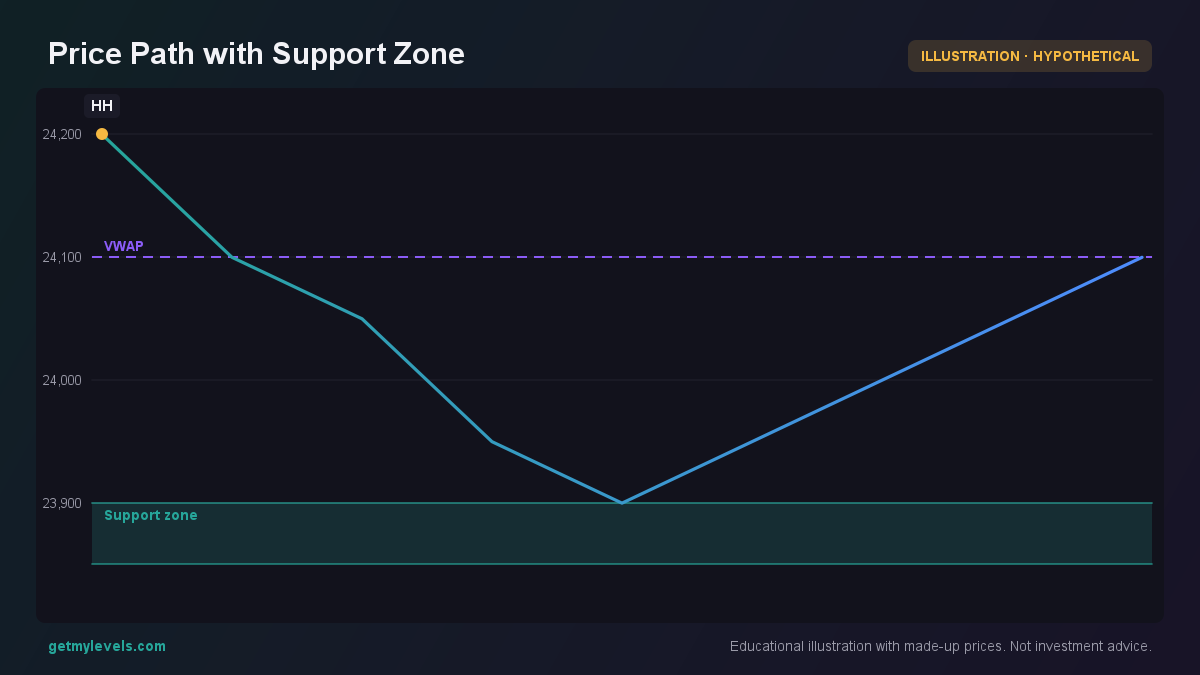 Figure 1: Price touches a support zone and then moves back up.
How Traders Read It – A Worked Example
Let’s walk through a hypothetical scenario. Suppose NIFTY is at 24,000. The nearest institutional support zone, built from the price history across multiple timeframes, spans 23,850 to 23,900. Many traders will see this zone and treat it as a reference point for potential price action.
If the price falls toward the zone, some traders might think the support is “strong” and expect a bounce. Others, however, might interpret the same price move as a sign that the market is adjusting away from the anchor. The key is to recognize the anchor and then test whether the price behavior aligns with it.
Figure 2 shows a scenario where the price breaks below the support zone and stays below it. This visual helps illustrate how the price can move away from the anchor, indicating that the zone may no longer be a reliable reference point.
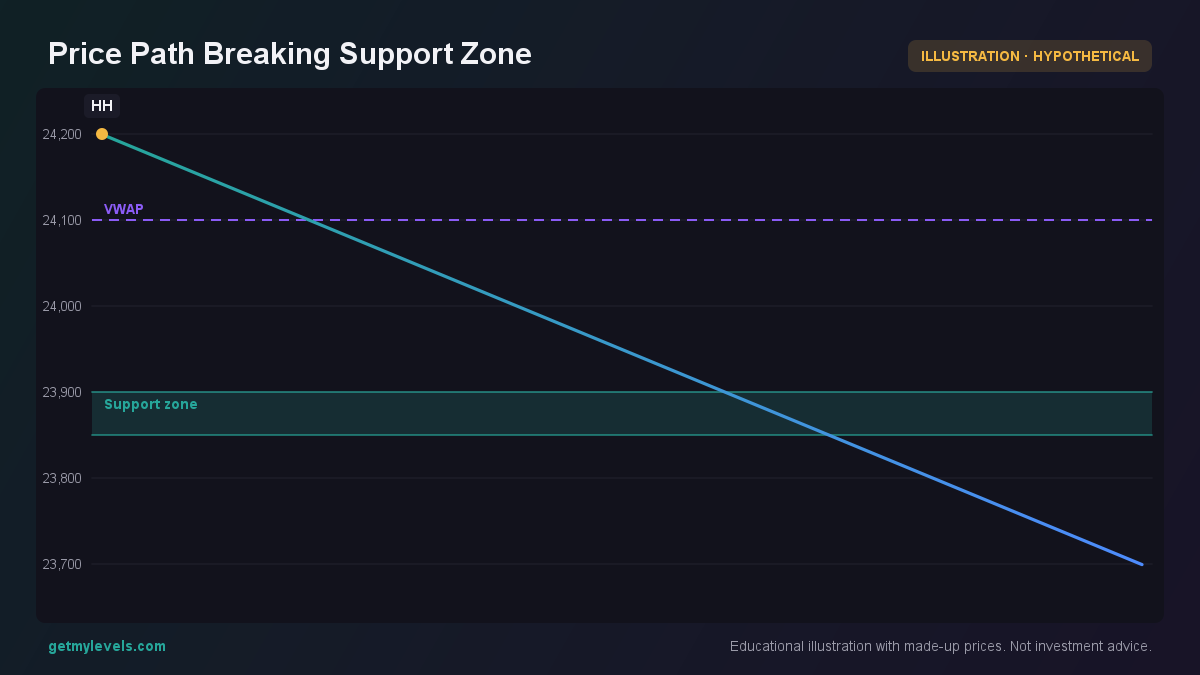 Figure 2: Price falls below the support zone and remains below it.
Reading Option-Chain Data
Option-chain open-interest (OI) levels can provide additional context. When many traders hold contracts at a particular strike, that strike can act as a psychological anchor. If the spot price is near that strike, the OI can reinforce the anchor’s perceived importance.
Figure 3 shows a bar chart of OI by strike around the 24,000 level. The highlighted strike (24,000) is surrounded by higher OI for calls and puts, indicating that many traders have positions that may influence market sentiment near that price.
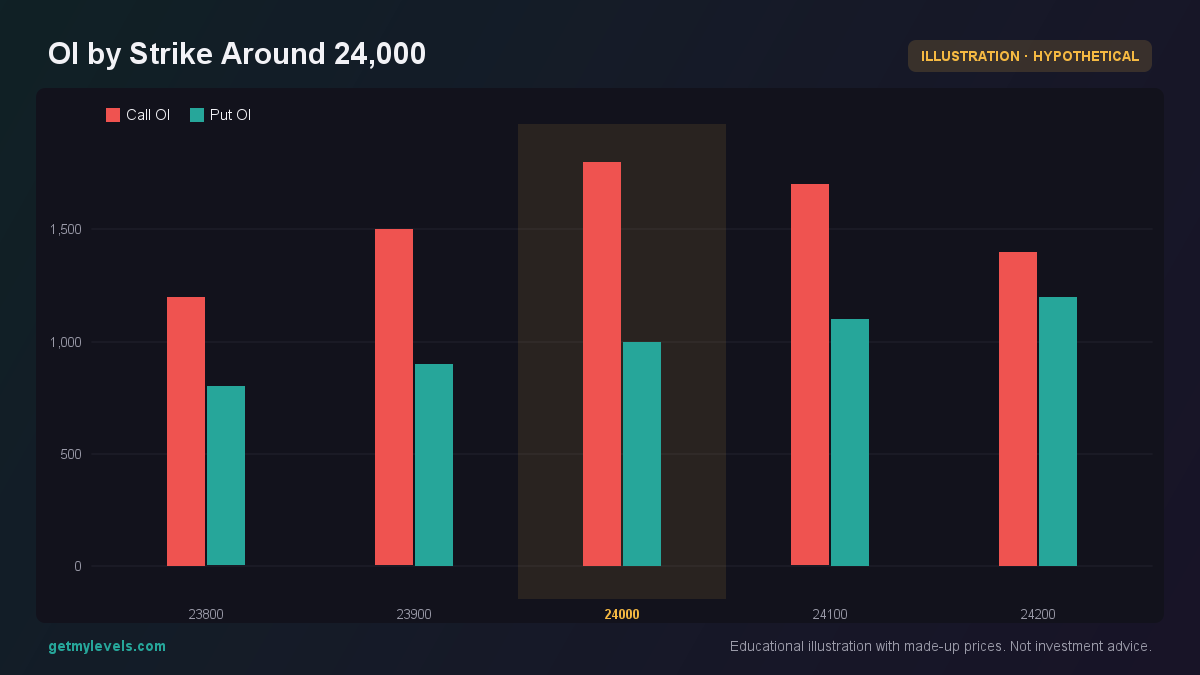 Figure 3: Call and put OI levels near the spot price.
Common Mistakes
| Mistake | Why It Happens | How to Avoid |
|---|---|---|
| Treating a single level as absolute | Anchors are often emotionally charged. | Compare multiple time-frame levels and look for consensus across them. |
| Ignoring price behavior after the anchor | The market may move away from the anchor. | Observe whether price actually respects the level; if it breaks and stays below, reconsider the anchor. |
| Over-reliance on OI without context | OI can be misleading if a large position is hedged. | Combine OI data with volume, price action, and order-flow indicators. |
How It Fits With Support and Resistance Zones
Support and resistance zones are not static lines; they are dynamic areas built from price history across many timeframes. Anchoring bias can cause traders to over-value a particular zone simply because it appears prominently on a chart or because it aligns with a popular OI strike.
By systematically evaluating each zone—checking how many timeframes it appears in, how many price points have touched it, and how the market behaves around it—traders can reduce the influence of anchoring. The live levels displayed on GetMyLevels provide a clear, up-to-date view of these zones, so you can see at a glance which zones are truly significant.
Summary
- Anchoring bias is the tendency to over-value an initial reference point, such as a support zone or a strike with high OI.
- Recognize the anchor by comparing it across multiple time-frames and observing price behavior.
- Use live levels (e.g., from GetMyLevels) to see which zones are built from comprehensive price history.
- Combine price action, OI, and order-flow data to confirm whether an anchor remains relevant.
- Always test whether the market respects or rejects the anchor before making a decision.
By staying aware of anchoring bias and using objective tools to evaluate support and resistance, you can keep your analysis grounded and make more informed, disciplined choices in the Indian F&O markets.
Written by an AI agent from GetMyLevels level data and checked by automated compliance rules. Educational, not investment advice. Not SEBI-registered.