Using Weekly and Monthly Levels to Add Context to Your NIFTY Trading
In this article you’ll learn how to use weekly and monthly levels as a backdrop for your daily NIFTY, BANK NIFTY and SENSEX trades. We’ll walk through a simple example with round-number zones, show how to read them on a chart, and point out common pitfalls. By the end you’ll know how these higher-time-frame levels fit with the support-and-resistance zones you already use on GetMyLevels.
What it is
Weekly and monthly levels are simply price ranges that have been significant on the 1-week and 1-month charts. They are drawn from the entire price history and can be used as a reference point for today’s moves. On GetMyLevels these levels appear as shaded zones on the live chart, and they are updated automatically as new data comes in.
The figure below shows a hypothetical price path that crosses a monthly support zone and then bounces off a weekly support zone.
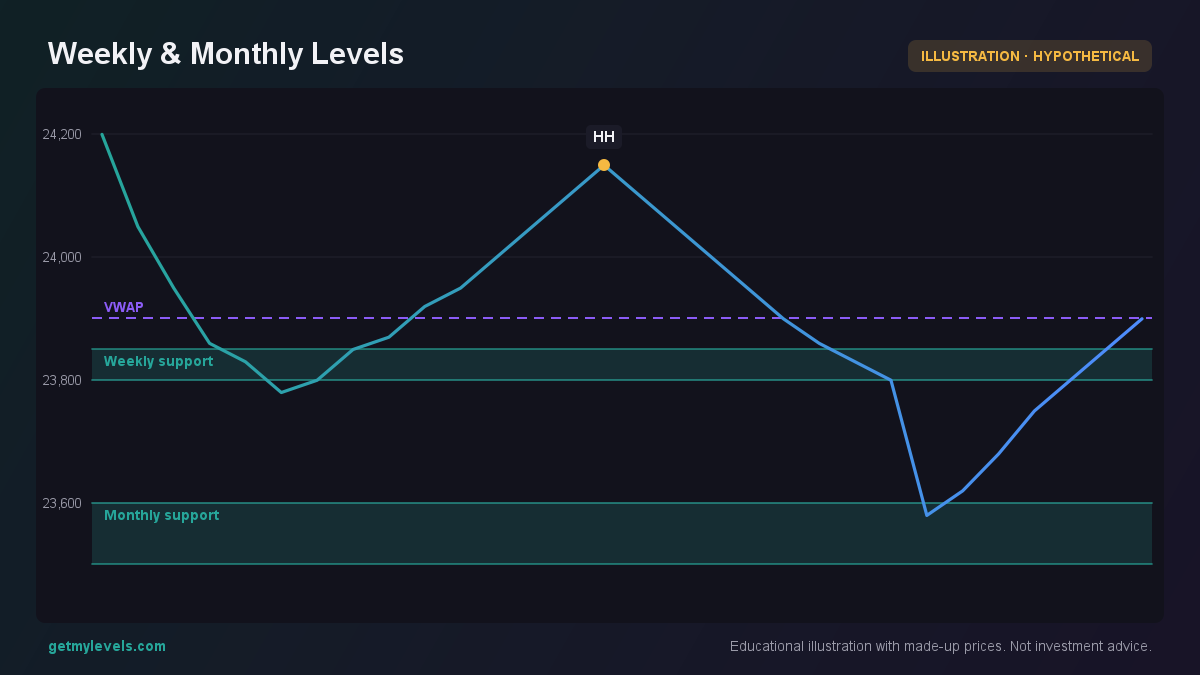 Figure 1: Price dips into the monthly support zone then bounces off the weekly support zone
Notice how the price enters the 23,500–23,600 zone (monthly support), crosses it, and then climbs above it. Later it touches the 23,800–23,850 zone (weekly support) and bounces back.
How traders read it (worked example)
Suppose today NIFTY is at 24,200. The nearest weekly support zone is 23,800–23,850, and the nearest monthly support zone is 23,500–23,600. Here’s how a trader might use these levels:
-
Look for a break or a bounce – If price slips below the weekly support, that might be a signal that the weekly level is losing its hold. If it stays above, the weekly support remains a reference point.
-
Combine with other tools – The daily chart on GetMyLevels will also show the daily VWAP, option-chain open interest at the 24,000 strike, and order-flow footprints. These add further context.
-
Watch the price action around the zone – In the figure below, the candle series shows how the price reacts to the weekly support. The 5th candle’s high at 24,180 confirms a bounce.
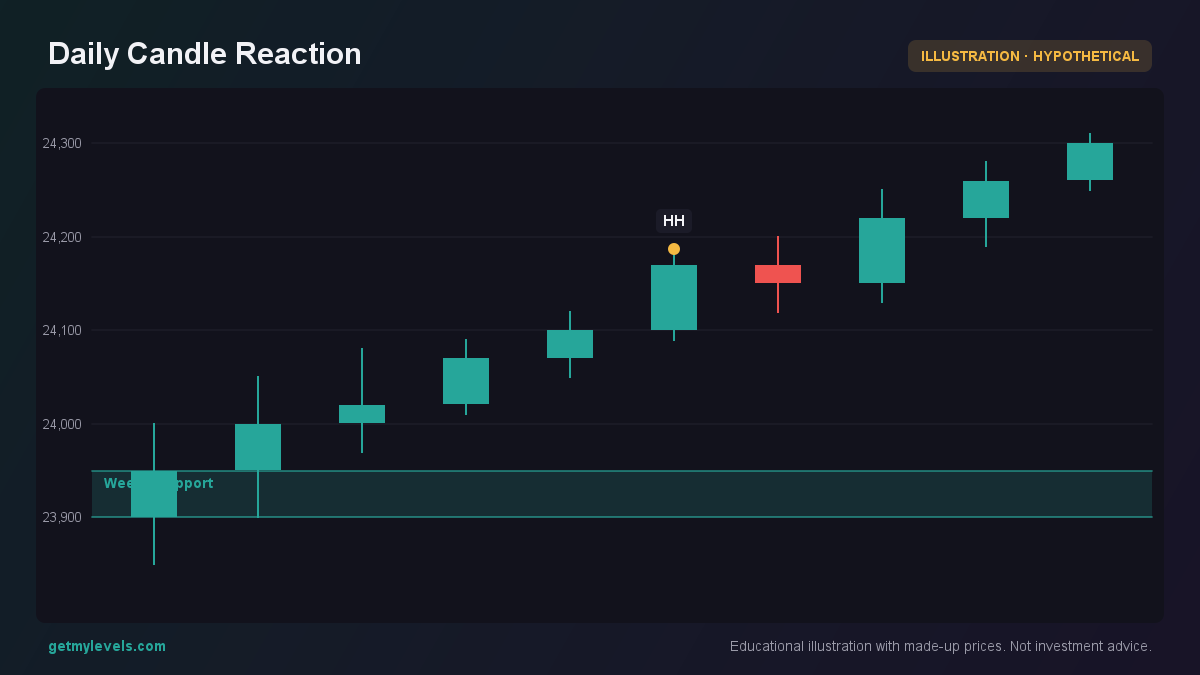 Figure 2: Candle series shows a bounce at the weekly support zone
-
Confirm with order-flow – A rising cum-delta during the bounce indicates buying pressure. If the delta is flat or negative, the bounce might be weak.
-
Use the level as a reference for risk management – Even if you don’t trade on the level, knowing that the price is near a weekly or monthly support helps you gauge how far it could move before hitting another significant zone.
Option-chain context
The option-chain open interest at the 24,000 strike is often a magnet for price. In the figure below, the call and put OI at 24,000 are balanced, but the call OI at 23,800 is higher than the put OI at the same strike. This skew can reinforce the weekly support zone.
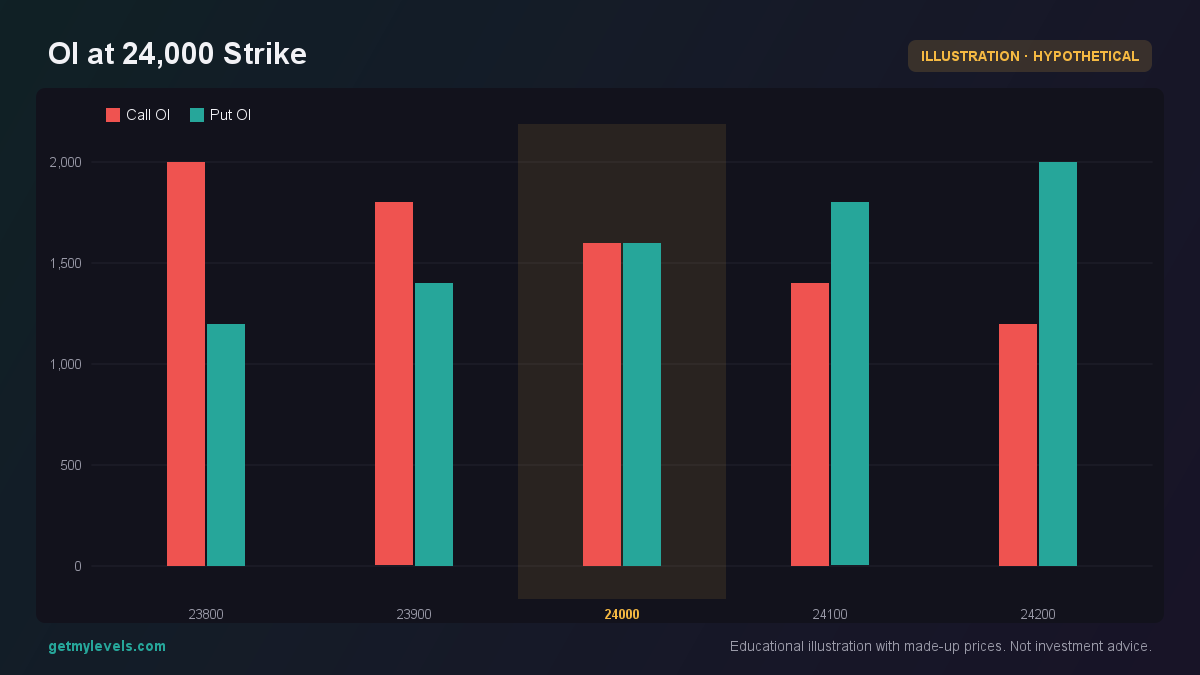 Figure 3: Call OI higher than put OI at 23,800 shows bullish bias at the weekly support
Common mistakes
- Treating a level as a target – A level is a reference, not a destination. Prices can bounce multiple times before moving on.
- Ignoring the time-frame hierarchy – A weekly level is more significant than a daily one, but a monthly level is still stronger. Don’t let a daily swing override a monthly trend.
- Overlooking the surrounding context – Levels look good only if they are supported by other signals like volume, VWAP, or OI. Relying on a single level can lead to misreading the market.
- Assuming levels are static – The levels on GetMyLevels are updated daily, so a zone that looked solid yesterday might shift slightly today.
How it fits with support and resistance zones
Weekly and monthly levels are a subset of the broader support-and-resistance framework. The daily support zone that you see on GetMyLevels often sits inside a larger weekly or monthly zone. By layering these levels, you can see whether the daily action is in line with the higher-time-frame structure.
For example, if the daily support at 24,000 is inside a weekly support at 23,800, you can interpret the daily support as a “micro-level” within the larger weekly context. This layered view can help you decide whether a move is a normal pullback or a potential breakout.
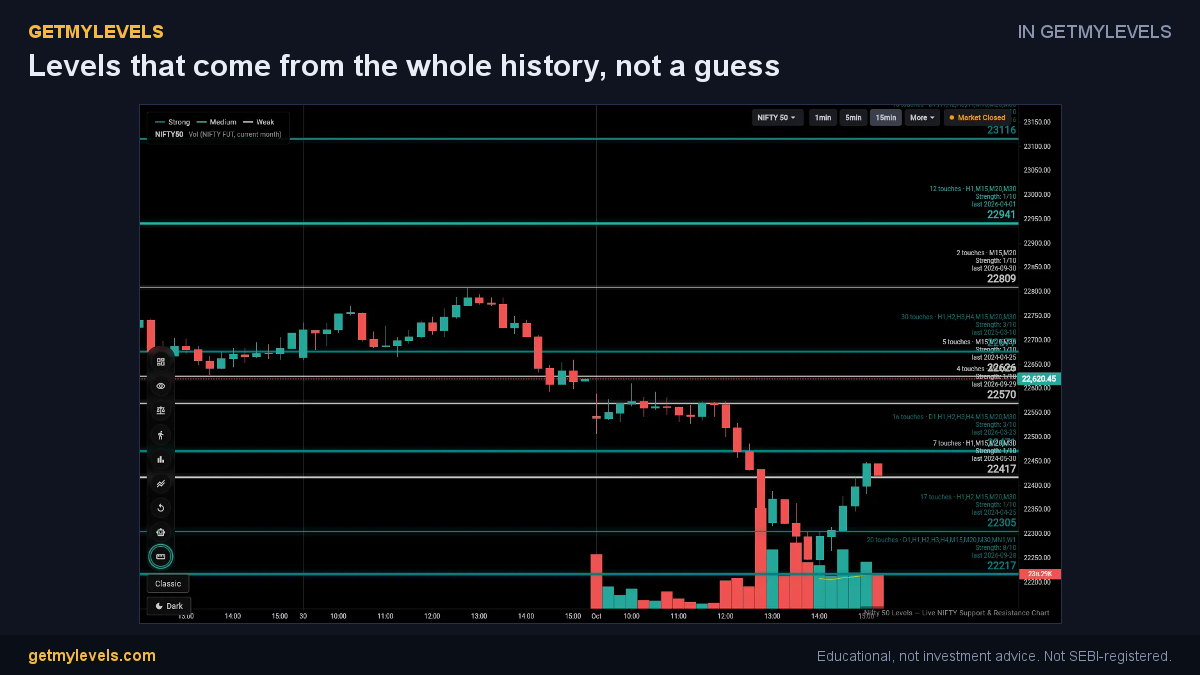 In GetMyLevels: Levels that come from the whole history, not a guess. The live chart draws this for NIFTY, BANK NIFTY and SENSEX.
Summary
- Weekly and monthly levels are price ranges derived from the 1-week and 1-month charts.
- They provide a backdrop for daily price action and help you gauge the significance of a bounce or break.
- Combine them with daily VWAP, OI, and order-flow to confirm the strength of a level.
- Avoid treating levels as hard targets; they are reference points.
- Use the GetMyLevels live chart to see these levels updated in real time, along with other technical overlays.
By incorporating weekly and monthly levels into your routine, you add another layer of context to your NIFTY, BANK NIFTY and SENSEX trades. The live levels on GetMyLevels give you a quick visual cue, making it easier to read the market’s structure at a glance.
Written by an AI agent from GetMyLevels level data and checked by automated compliance rules. Educational, not investment advice. Not SEBI-registered.