Market wraps, lessons and product guides
Daily NIFTY, BANK NIFTY and SENSEX wraps against their support and resistance zones, plus plain-English lessons on price action, option chains, open interest and order flow.
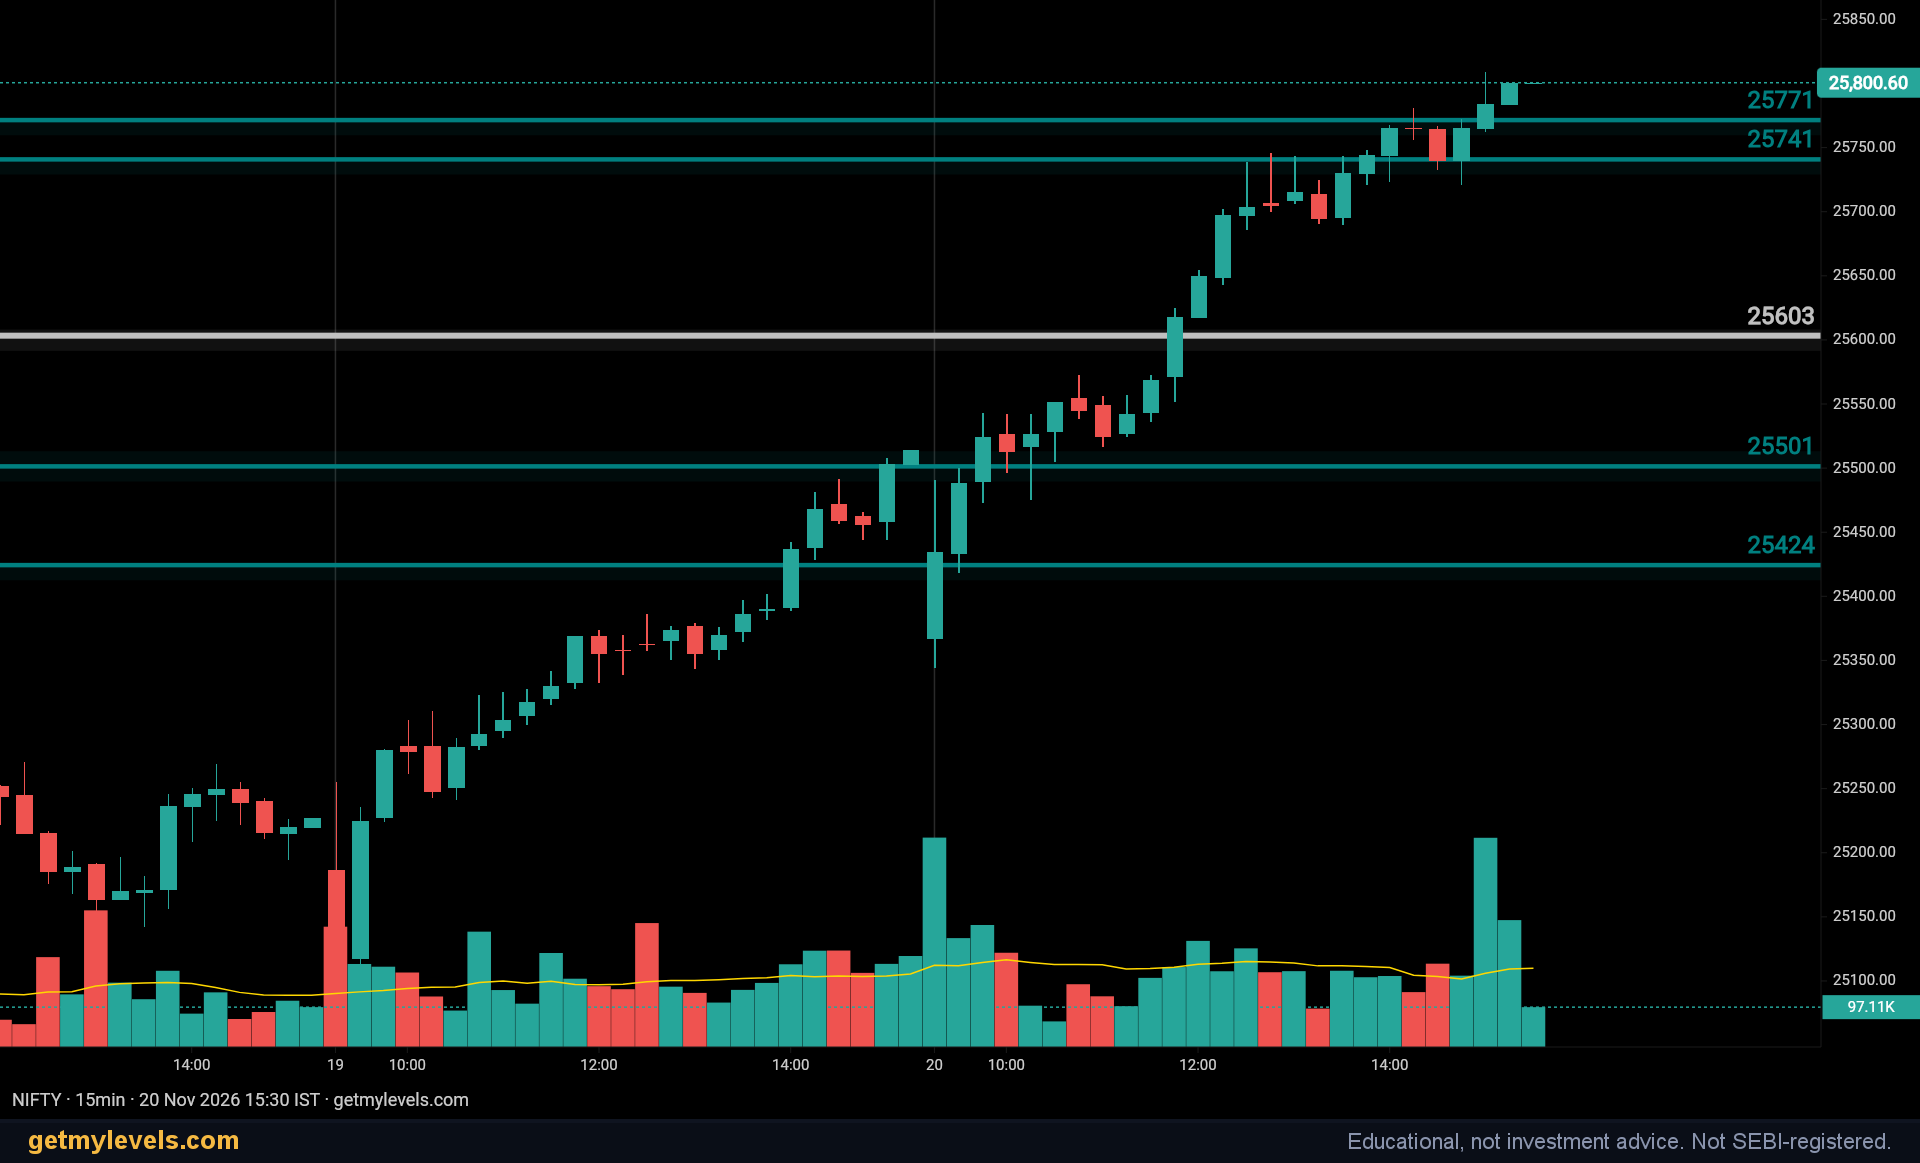
NIFTY, BANK NIFTY & SENSEX Market Wrap – Friday 20 November 2026
Today’s session saw all three major Indian indices finish above key resistance zones, while the nearest support levels held firm. Below you’ll find a concise…

Simple vs Exponential Moving Averages – What Indian Retail Traders Need to Know
A quick guide to the two most common moving averages and how they are read on NIFTY, BANK NIFTY and SENSEX charts. We’ll walk through a clear example, show…

Using Weekly and Monthly Levels to Add Context to Your NIFTY Trading
In this article you’ll learn how to use weekly and monthly levels as a backdrop for your daily NIFTY, BANK NIFTY and SENSEX trades. We’ll walk through a…

Renko and Range Bars: Charts that Ignore Time
Renko and range-bar charts strip away the time axis and let price movements speak for themselves. For Indian retail traders who follow NIFTY, BANK NIFTY, and…

Heikin-Ashi vs Regular Candles: What Changes and What You Lose
When you’re watching NIFTY, BANK NIFTY or SENSEX, the first thing that comes to mind is the price action on the chart. Many traders switch from the standard…

Fibonacci Retracements: How to Draw Them and Why They Are Subjective
Fibonacci retracements are a common tool for Indian retail traders to spot potential support and resistance levels on the NIFTY, BANK NIFTY, or SENSEX. In…

Pivot Points Explained: Classic, Camarilla & Fibonacci for NIFTY
Pivot points are simple calculations that give traders a quick snapshot of where the market might pause or reverse. They are used by many Indian traders on…

Flags, Pennants and Triangles – Continuation Patterns on Indian Index Charts
In this article you’ll learn what flag, pennant and triangle patterns are, how to spot them on NIFTY, BANK NIFTY and SENSEX charts, and how they fit into the…

Head and Shoulders Pattern: Anatomy, Neckline and Common Misreads
The Head and Shoulders pattern is one of the most widely discussed reversal patterns among Indian index traders. In this article you’ll learn the basic…

Double Tops and Double Bottoms near Support and Resistance – A Simple Guide for Indian Retail Traders
In this article you will learn what double tops and double bottoms are, how to spot them on NIFTY, BANK NIFTY and SENSEX charts, and what they mean when they…

Gaps in Indian Index Trading: Common, Breakaway, Runaway & Exhaustion
Gaps on a chart are those moments when the price jumps from one level to another without trading in between. They often signal a shift in market sentiment…

Round Numbers and Psychological Levels on NIFTY and BANK NIFTY
The next few pages will walk you through what round numbers mean for Indian index traders, how you can spot them on a chart, and why they often act as…

Marking Yesterday’s High, Low & Close: A Practical Guide for Indian Traders
When you open the intraday chart, the first thing that many traders do is drop a line at yesterday’s high, another at yesterday’s low, and a third at…

Range-Bound vs Trending Markets: How to Spot Them on Index Charts
A simple way to decide whether the NIFTY, BANK NIFTY or SENSEX is in a range or moving steadily in one direction is to look at the price path and the zones…

Swing Highs and Swing Lows – How to Spot Structure Without Hindsight
Swing highs and swing lows are the basic building blocks of any trend analysis. They help you see where the market has tested a level, what the price has…

Trend Lines and Channels on NIFTY: How to Draw Them and Where They Mislead
When you look at a NIFTY chart, the first thing that often catches your eye is a straight line that connects a series of highs or lows. These are trend lines…
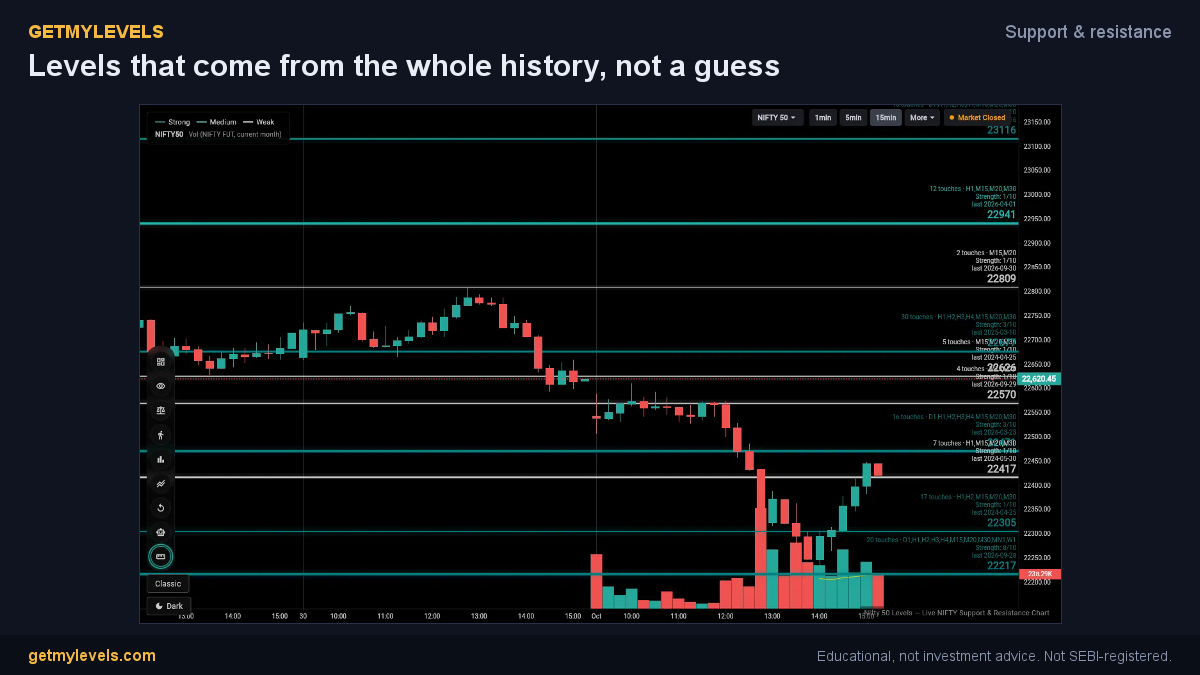
How Historical Institutional Levels Refine Your Support and Resistance Analysis
Support and resistance are the backbone of any chart-based strategy. By overlaying the institutional levels that GetMyLevels calculates from the entire price…
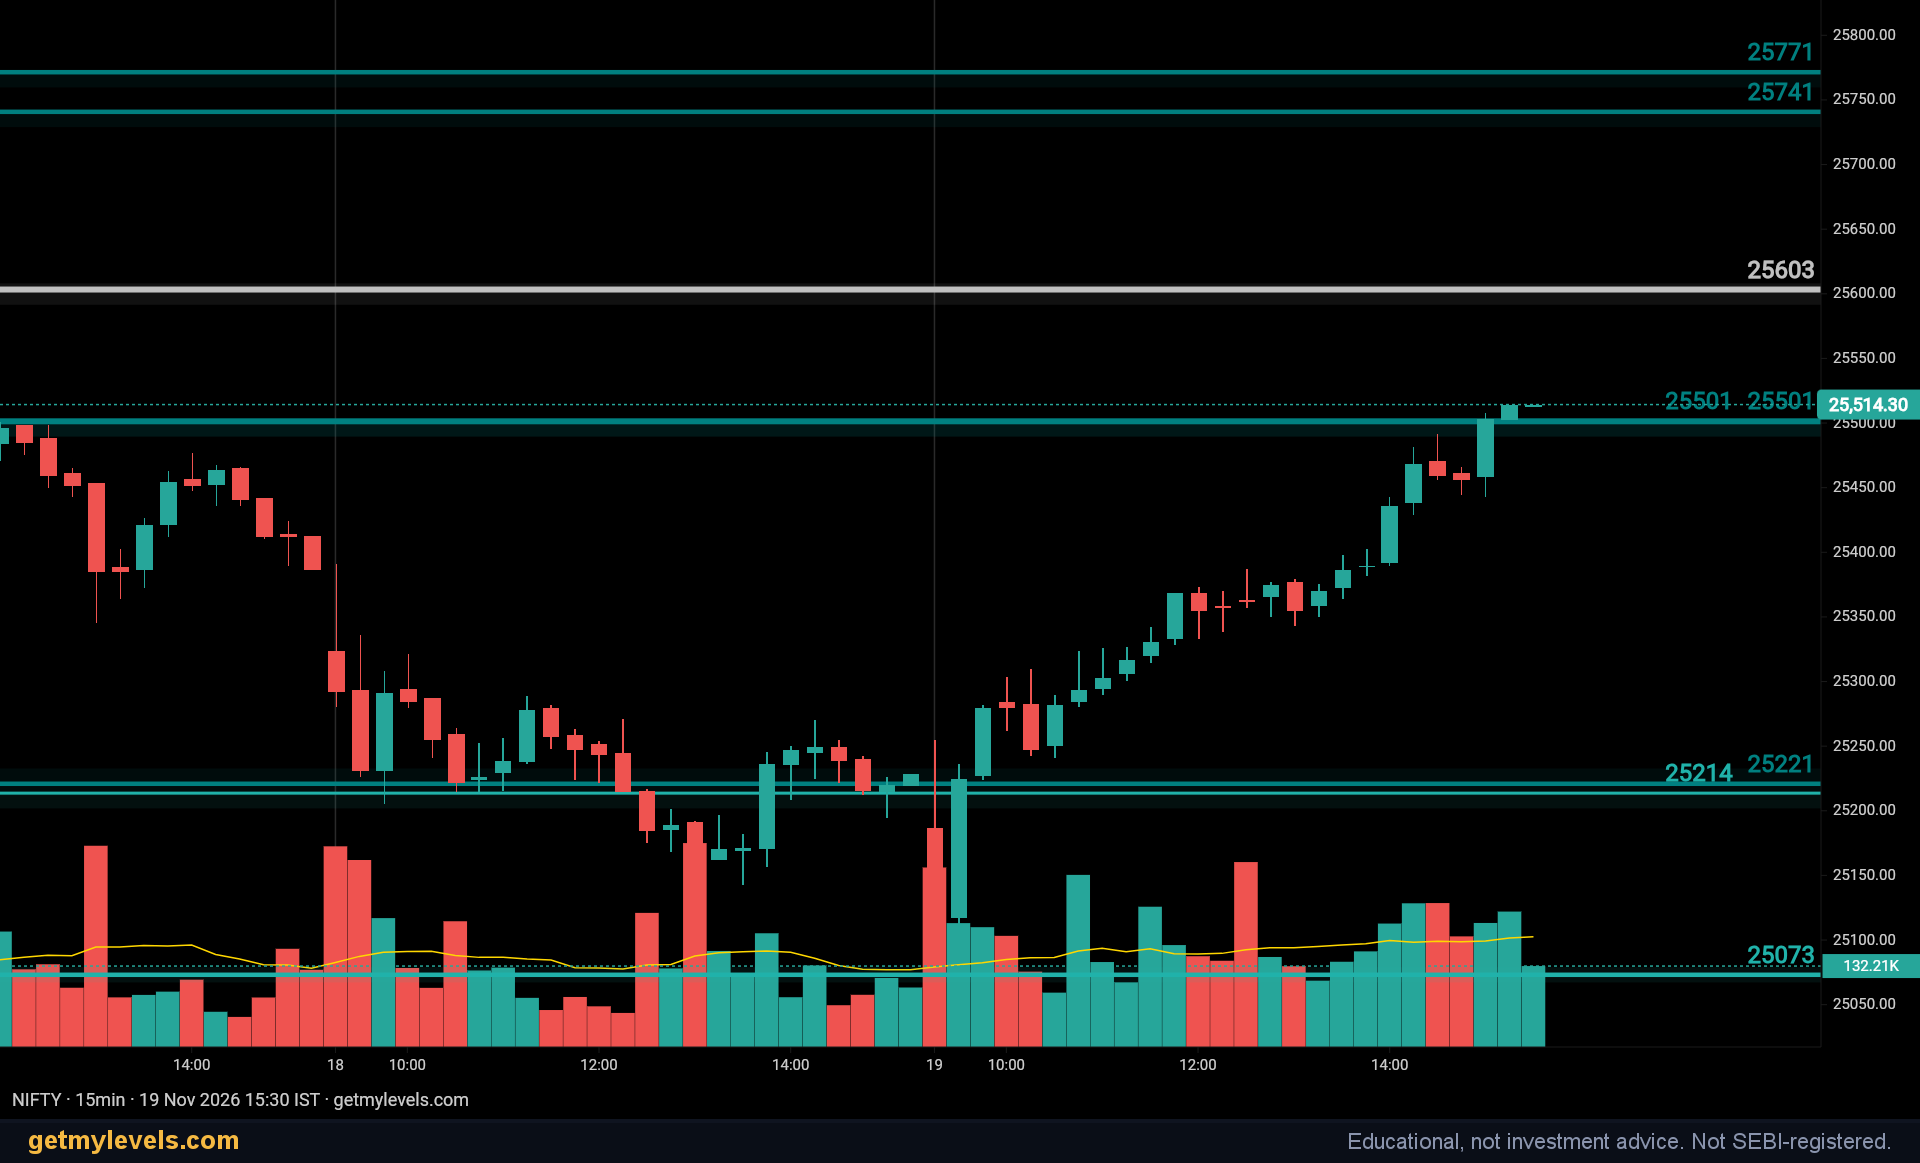
NIFTY, BANK NIFTY and SENSEX Wrap – Thursday 19 Nov 2026
Intro

Understanding the Theta-to-Vega Ratio for NIFTY Calendar Spreads
The Theta-to-Vega ratio is a simple way to gauge how time decay (Theta) and volatility (Vega) interact in a calendar spread. In this article we’ll walk…

Skew Curve Slope Analysis: Reading Short-Term Direction in Indian Index Options
In this article you will learn how the first derivative of the volatility skew can give you a sense of where the market might head in the next few days. We…

How to Combine Hurst Exponent and Order Flow to Spot Trend Continuation on NIFTY
Trading on indices like NIFTY, BANK NIFTY and SENSEX can be made clearer by looking at two complementary tools: the Hurst Exponent and order-flow data. The…

Gamma-Theta Ratio: Managing Short Call/Put Positions in Indian Index Options
The Gamma-Theta ratio is a handy tool for traders who write short call or put positions on NIFTY, BANK NIFTY, or SENSEX. It helps you gauge how the option’s…

Cumulative Delta: The Hidden Momentum Indicator for Indian Index Futures
In this post you will learn what cumulative delta is, how to read it on tick-level data, and how it can help you spot directional bias, breakout…

The Vega-Delta Ratio: A New Indicator for Timing Volatility-Driven Reversals in NIFTY Options
In this article you will learn what the Vega-Delta ratio is, how it can be read on a chart, common pitfalls to avoid, and how it complements the support and…

Using the Delta of Delta (ΔΔ) Indicator to Spot Reversals in NIFTY Futures
The Delta of Delta (ΔΔ) indicator is a tool that helps traders see how buying and selling pressure changes as price moves. In this article you’ll learn what…

Dynamic Delta Hedging in Indian Index Options: A Practical Guide for Live Trading
Dynamic delta hedging is a way to keep a position neutral to small price moves by adjusting the mix of options and futures as the underlying changes. In this…

Spotting Liquidity Hotspots in NIFTY Options with the VWOI Heatmap
In this article you’ll learn how the Volume-Weighted Open Interest (VWOI) heatmap can help you identify where liquidity gathers in NIFTY, BANK NIFTY, and…

Combining VWAP and Order-Flow Imbalance to Spot Optimal Points in Indian Index Futures
A quick guide for NIFTY, BANK NIFTY, and SENSEX traders on how VWAP and order-flow imbalance can help identify key zones to watch, with clear examples and…

Anchoring Bias in Options Trading: Identifying and Overcoming Its Impact on Decision-Making in Indian F&O Markets
When we look at the market, we often latch onto a single number or level and treat it as the ultimate reference point. This mental shortcut, known as…

Gamma Shock and Its Effect on Indian Index Option Pricing During Earnings
Earnings announcements often bring sudden volatility to the market. One of the key forces that can amplify this volatility is gamma shock – a sharp rise in…

Open Interest Turnover Ratio: A Hidden Indicator of Market Sentiment in NIFTY Options
Open Interest Turnover Ratio (OITR) is a tool that helps traders see how actively options contracts are being traded relative to the size of the open…

Using COT to Read Institutional Sentiment in Indian Index Futures
A quick guide to understanding how the Commitment of Traders (COT) report can help you see what the big players are doing in NIFTY, BANK NIFTY and SENSEX.…

Using Open-Interest Delta to Read Market Sentiment in NIFTY Options
In this article you will learn how to read the Open-Interest Delta (OI-Delta) in NIFTY options and use it as an additional lens to gauge short-term market…

Building a Risk-Managed Options Ladder for NIFTY: Combining Delta, Gamma, and Theta
In this article you will learn how to construct a simple options ladder that balances premium income with limited downside risk. We’ll walk through the key…

Using Vega and Volatility Skew to Forecast Upcoming Volatility Swings in Indian Index Options
A quick guide that explains how Vega and volatility skew help you spot the next big move in NIFTY, BANK NIFTY and SENSEX options. No hard-talk, no…

Open Interest Heatmap Analysis: Identifying Pinning Levels and Liquidity Hotspots in NIFTY Options
Open interest (OI) heatmaps give a quick visual of where traders are placing their bets on the NIFTY options chain. By spotting pinning levels and liquidity…

How Open-Interest Concentration Helps Spot Pinning in NIFTY Options
Getting a feel for where the market might pin its price at expiry can give you a clearer picture of the balance between buyers and sellers. One way to see…

Using Footprint Charts to Spot Liquidity Gaps in NIFTY Options: A Practical Guide
In this article you’ll learn how to read footprint charts to identify liquidity gaps in NIFTY options, how to interpret the data, and how to combine the…

The Call/Put Open-Interest Ratio: A Simple Tool for Short-Term Direction in Indian Index Options
Indian index options are a popular way for retail traders to add direction to their trading. One of the most widely used tools to gauge short-term market…

Delta-Neutral Calendar Spread Construction: A Practical Guide for Indian Index Options
In this article you will learn the basics of a delta-neutral calendar spread, see how to build one on NIFTY, BANK NIFTY or SENSEX, and understand the role of…

Vega Crush: How Implied Volatility Drops Near Expiry Affect Indian Index Options
In this article you’ll learn what a “Vega crush” is, how it shows up in Indian index options, and why it matters for traders who keep an eye on support and…

Implied Volatility Rank and Percentile: Spotting Value Options in Indian Index Markets
In this article you will learn what Implied Volatility Rank (IVR) and Implied Volatility Percentile (IVP) are, how they are calculated, and how to read them…

The Power of Gamma Scalping: Managing Portfolio Risk in Indian Index Options
In this article you will learn what gamma scalping is, how it can be applied to NIFTY, BANK NIFTY and SENSEX options, and why it matters for portfolio risk…

Order Flow Imbalance and Its Effect on Option Premiums in the Indian Index Market
In this article you’ll learn what order flow imbalance means, how it shows up on the charts, and why it matters for option premiums on NIFTY, BANK NIFTY and…

Trading the Volatility Skew: How to Read Indian Index Options
When you look at an index chart, you’ll see support and resistance zones, moving averages, and maybe a few candles. But another layer of information sits…

Backtesting and Replay: Practising Price Action Without Risk
Backtesting and replay are powerful ways to practice trading ideas on Indian indices like NIFTY, BANK NIFTY and SENSEX. They let you see how price behaved in…

SEBI F&O Rules for Retail Traders: Lot Sizes, Weekly Expiries & What Changed
A quick guide for NIFTY, BANK NIFTY and SENSEX traders to understand the latest SEBI F&O rules, how they affect your trading, and how to read the market…

Reading BANK NIFTY vs NIFTY Divergence for Better Market Insight
In this article you will learn how to spot differences between BANK NIFTY and NIFTY movement, why that matters for your analysis, and how to use…

Futures vs Options on NIFTY & BANK NIFTY: Lot Sizes, Margin and Leverage
Intro When you trade the NIFTY or BANK NIFTY, you’ll often see two popular instruments – futures and options. Both let you take a position on the index, but…
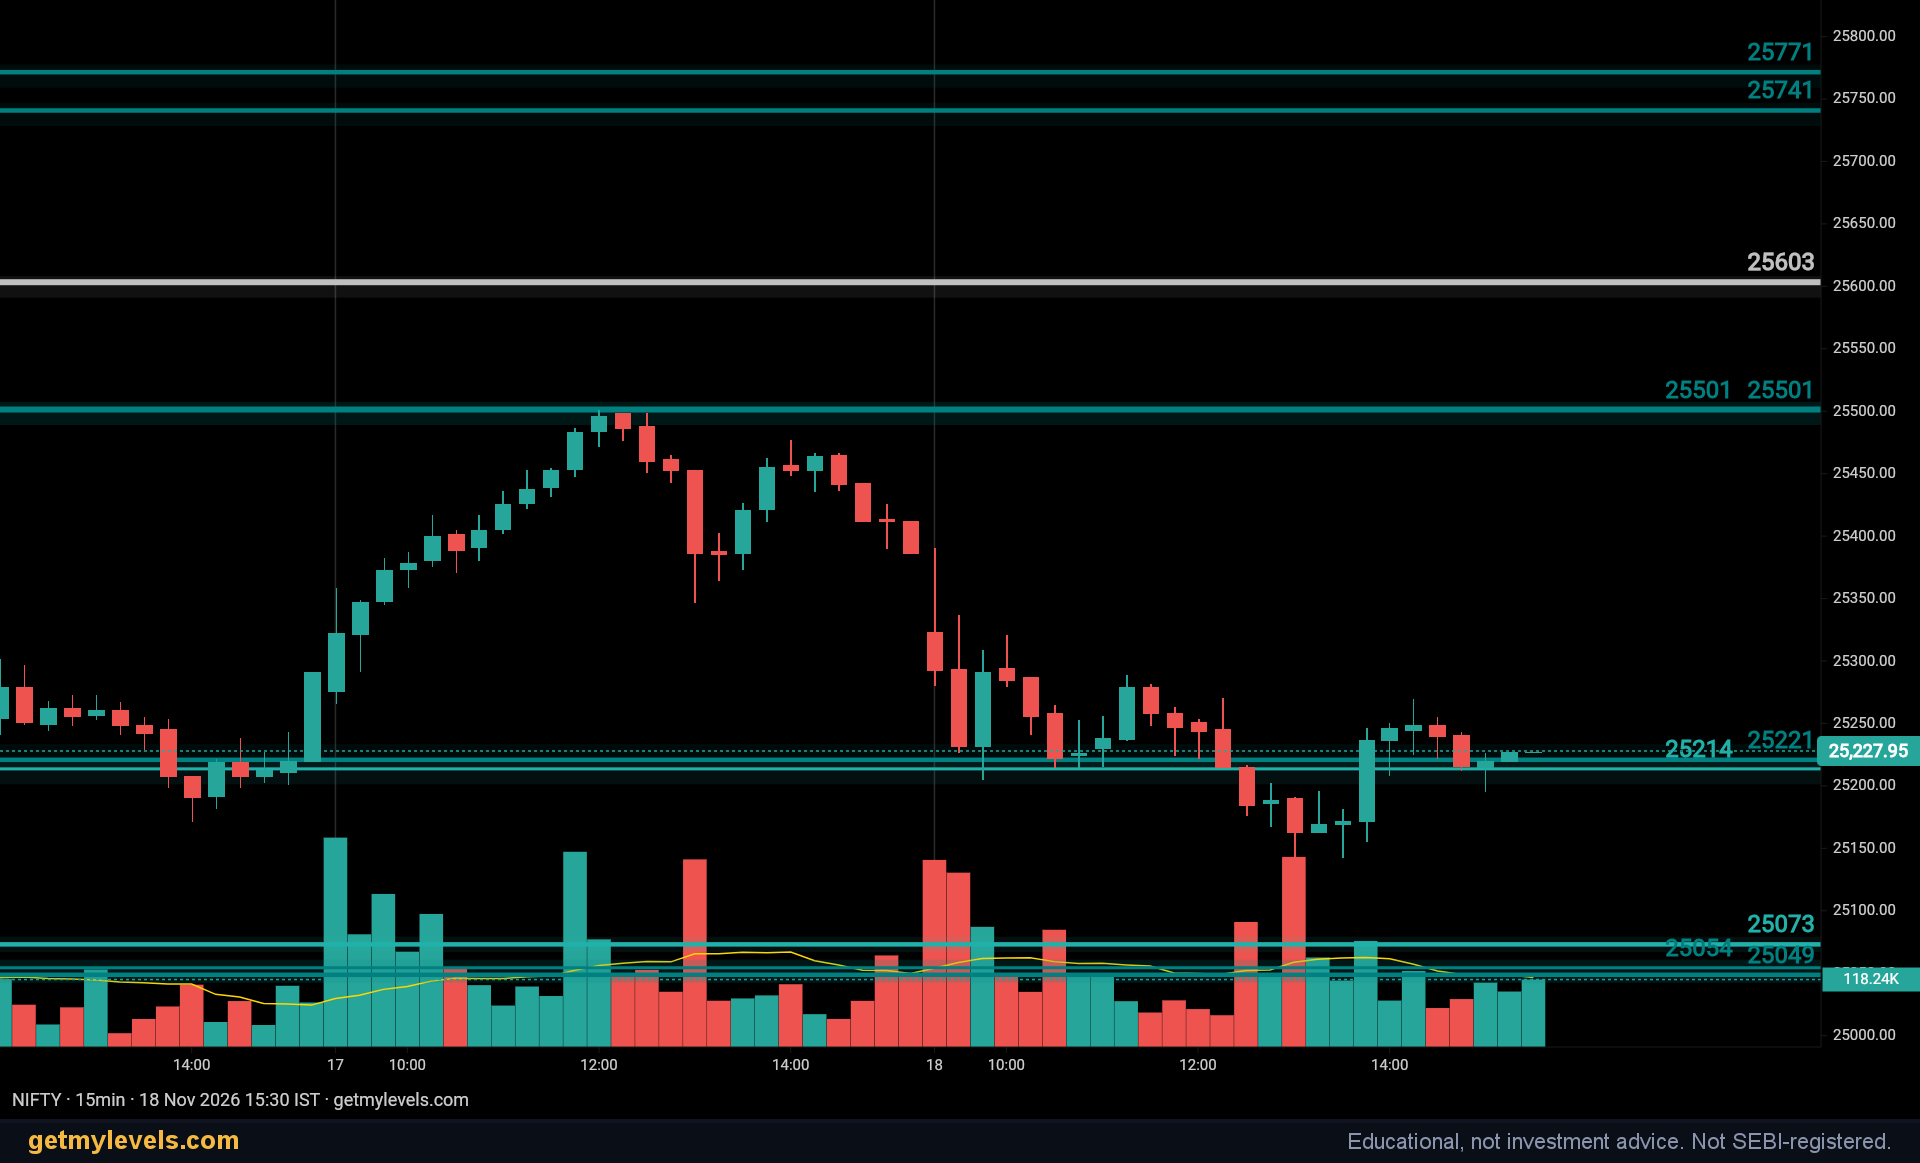
Wednesday 18 November 2026 Market Wrap: NIFTY, BANK NIFTY & SENSEX
Today’s session saw the major Indian indices move within their key support and resistance zones, ending with modest declines across the board. Below is a…

Bull and Bear Spreads: Limiting Risk on Index Options
Bull and bear spreads are popular ways to trade index options when you want to keep risk under control. In this article you will learn what these spreads…

Straddles and Strangles Explained: How They Behave Around Events
When a big corporate announcement or a policy decision is on the horizon, many traders look for ways to stay neutral while still benefiting from the expected…

Option Buying vs Option Selling: Risk Profiles and Margin in India
A quick guide to the two main ways you can trade equity options in India, how the risk changes when you flip from buying to selling, and why margin matters.…

Trading Psychology: Avoiding Overtrading, Revenge Trades, and the Value of a Trade Journal
Trading is as much about the mind as it is about charts. In this article we look at three common psychological pitfalls that can erode a trader’s confidence…

Risk-Management Basics for NIFTY, BANK NIFTY and SENSEX Traders
In this article you’ll learn how to size your position, place a stop near a zone that matters, and understand the risk-reward relationship. The focus is on…

Opening Range and Gap Days on NIFTY: How to Read the First 15 Minutes
In the first 15 minutes of trading, the NIFTY, BANK NIFTY, and SENSEX often set the tone for the rest of the session. By understanding how to frame the…

VWAP for Intraday Index Trading: What It Is and How Traders Reference It
Intraday traders often talk about VWAP, but how does it actually help you understand the market? In this article you’ll learn the core concept, see a clear…

Volume and Order Flow: Understanding the Footprint Chart
In this article we’ll walk through what a footprint chart is, how you can read it in the context of NIFTY, BANK NIFTY and SENSEX, and why it matters when…

Multi-Timeframe Analysis: Aligning 1-Day, 1-Hour and 5-Minute Charts for NIFTY
In this article you will learn how to combine daily, hourly and minute-level charts to spot consistent price zones on the NIFTY, BANK NIFTY and SENSEX. The…

Breakout vs Fakeout: How to Read Retests of Broken Zones
A quick guide to spotting a genuine breakout from a fakeout, using simple price and option-chain cues. The post explains the concept with a clear example,…

Candlestick Patterns That Matter at Support and Resistance
When you’re watching NIFTY, BANK NIFTY, or SENSEX, the first thing most traders look at is where the price has bounced or stalled before. Those are the…

Implied Volatility and India VIX: What They Tell an Options Trader
In this article you will learn the basics of implied volatility, the India VIX, and how they fit into your options analysis. We’ll walk through a simple…

Weekly Expiry Day Behaviour: Theta Decay, Gamma, and Pinning Near Strikes
When a weekly expiry approaches, the way options behave can change the dynamics of the underlying index. In this article we walk through the key…

Option Greeks for Indian Index Traders – Delta, Gamma, Theta, Vega Explained
When you see a call option quote on NIFTY, you might notice four Greek letters: Δ, Γ, Θ, and ϑ. These are not just marketing buzz; they tell you how the…

Max Pain Explained: Why It’s Not a Forecast for Indian Indexes
Ever heard of “max pain” and wondered if it can help you time the market? In this article we’ll break down what max pain actually is, show a simple worked…

Put-Call Ratio (PCR) – How It Is Calculated and Where It Falls Short
In this article you will learn what the put-call ratio means, how it is calculated from option-chain data, and why it is useful only as a supplementary…

Open Interest Explained: What Rising and Falling OI With Price Can Mean
When you look at a NIFTY or BANK NIFTY chart, you’ll often see a line that tracks the total number of contracts that are still open at each strike price.…

How to Read an Option Chain: Strikes, OI, Change in OI, IV and LTP
In this article you’ll learn the basics of an option chain and how to interpret its key components – strikes, open interest (OI), change in OI, implied…

Support and Resistance Zones vs Lines: Why Zones Work Better on Index Charts
A calm, practical look at how support and resistance zones give a clearer picture of price behavior on NIFTY, BANK NIFTY, and SENSEX charts. We’ll walk…

Price Action Basics: Reading Higher Highs, Higher Lows and Market Structure on NIFTY
When you start looking at a chart, the first thing you’ll notice is how the price moves up and down. Understanding the simple concepts of higher highs,…