The Call/Put Open-Interest Ratio: A Simple Tool for Short-Term Direction in Indian Index Options
Indian index options are a popular way for retail traders to add direction to their trading. One of the most widely used tools to gauge short-term market sentiment is the Call/Put Open-Interest Ratio (PCR). In this article you’ll learn what the ratio is, how traders read it, common mistakes to avoid, and how it ties in with the support and resistance zones that GetMyLevels displays on every live chart.
What it is
Open interest (OI) is the total number of contracts that are still open at a given strike price. The PCR is simply the ratio of Call OI to Put OI at a chosen strike, usually the one nearest the current index level. A high PCR indicates that more traders are holding call positions (bullish), while a low PCR points to more put positions (bearish).
The figure below shows a hypothetical price path for NIFTY, with a support zone marked. The PCR is calculated at the 24,000 strike.
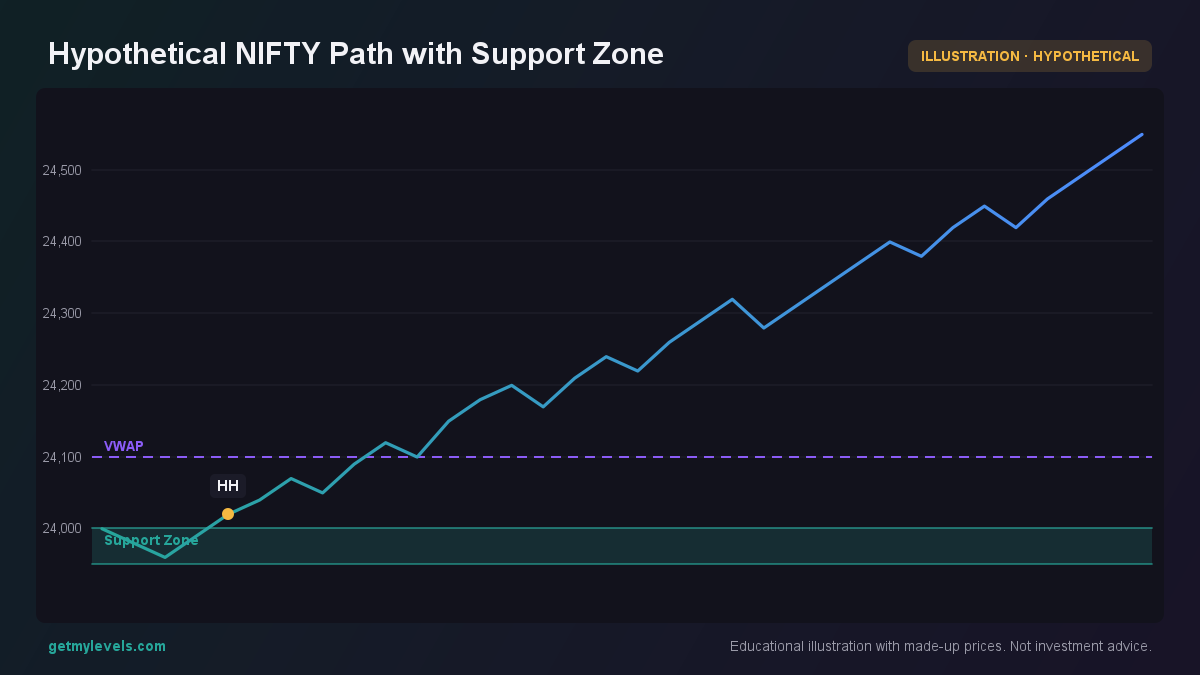 Figure 1: Price touches the support zone and then moves up. PCR at 24,000 shows 1.8:1.
Notice that the price dips into the support zone and then retraces upwards.
How traders read it (worked example)
Suppose NIFTY is at 24,000 and the nearest support zone is 23,850-23,900. At the 24,000 strike the Call OI is 12,000 contracts and the Put OI is 6,000 contracts. The PCR is therefore 12,000 ÷ 6,000 = 2.0.
A PCR of 2.0 means that the number of call contracts is twice the number of put contracts. In this scenario, traders often look at the PCR trend rather than a single value. If the PCR has been moving up over the last few days, it suggests a growing bullish interest. If it has been declining, bearish interest is increasing.
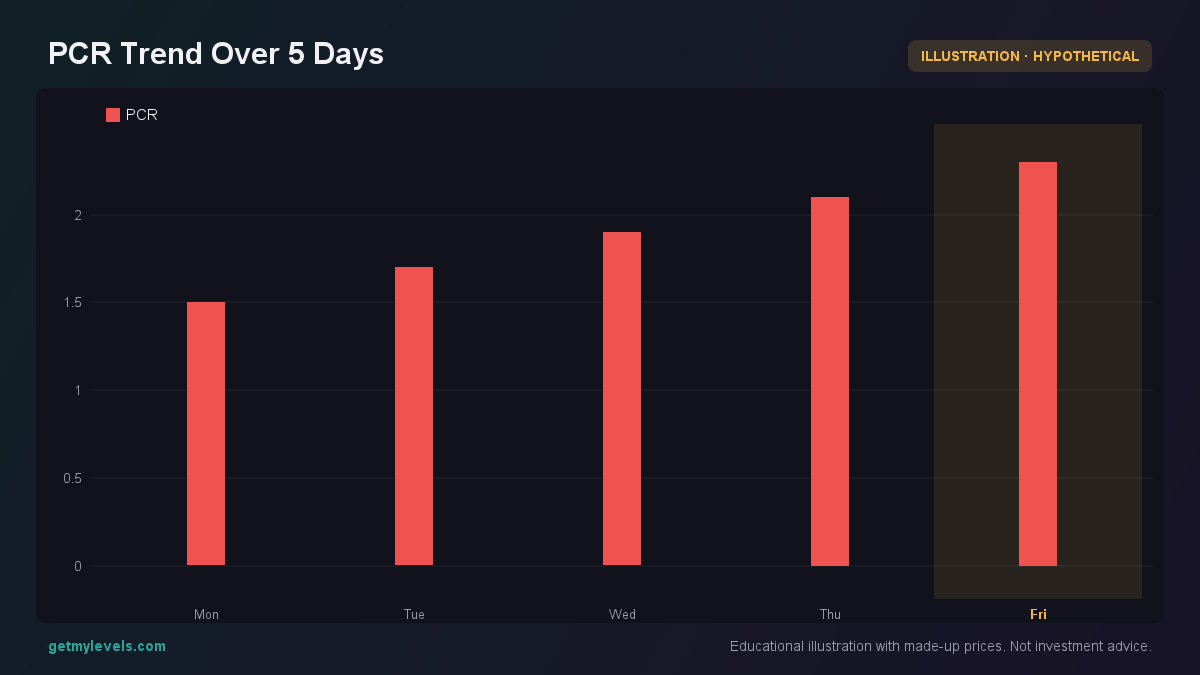 Figure 2: PCR values trend upward, indicating bullish sentiment.
Below is a bar chart showing the Call and Put OI for strikes around 24,000. The highlight marks the 24,000 strike.
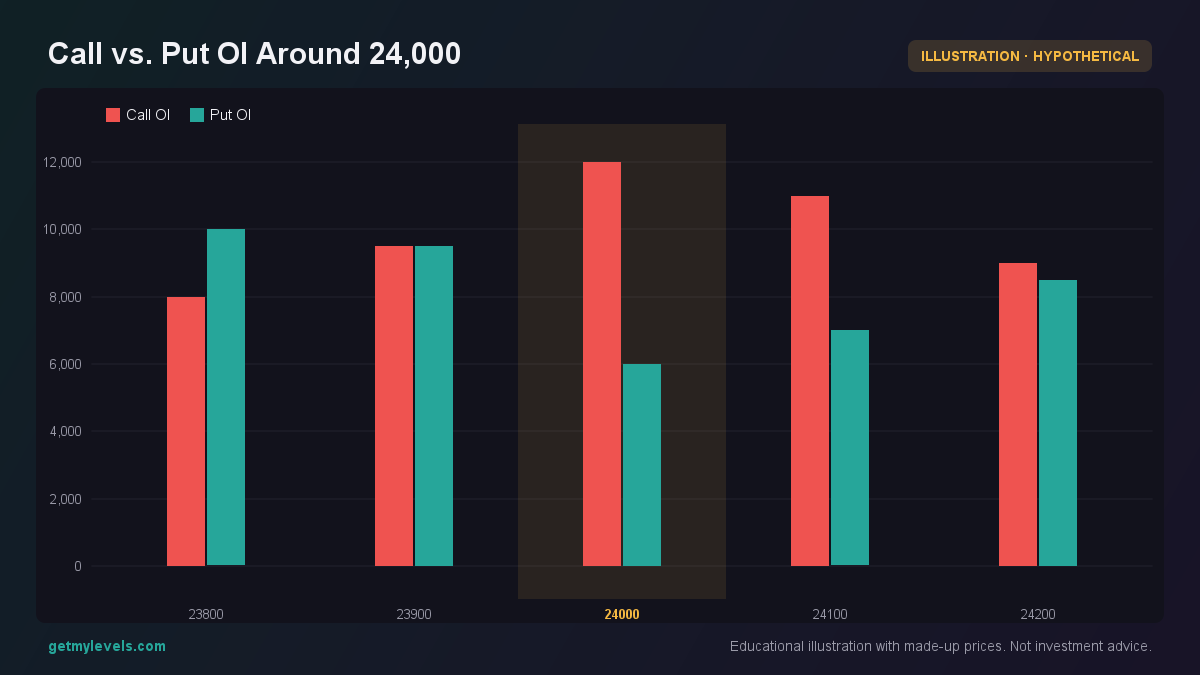 Figure 3: Call OI dominates at 24,000, giving a PCR of 2.0.
Notice the clear advantage of Call OI at 24,000.
Common mistakes
- Using PCR in isolation – The ratio tells you about sentiment but not about price levels. Pair it with structural levels (support, resistance) for a fuller picture.
- Ignoring trend direction – A high PCR on a downtrend can be a warning that the trend may still continue lower.
- Relying on a single strike – Look at a range of strikes around the index level to see if the bias is consistent.
- Over-reacting to daily swings – PCR can fluctuate from day to day; focus on the trend over several days.
How it fits with support and resistance zones
The support and resistance zones that GetMyLevels draws from the entire price history provide the context in which the PCR operates. If the PCR is bullish and the price is approaching a strong resistance zone, the bias may be to watch for a breakout. If the PCR is bearish and the price is near a support zone, traders may observe how the price behaves when it touches that level.
Here the price is testing the resistance zone while the PCR trend remains bullish. The combination of these two signals can help a trader decide what to watch for in the next session.
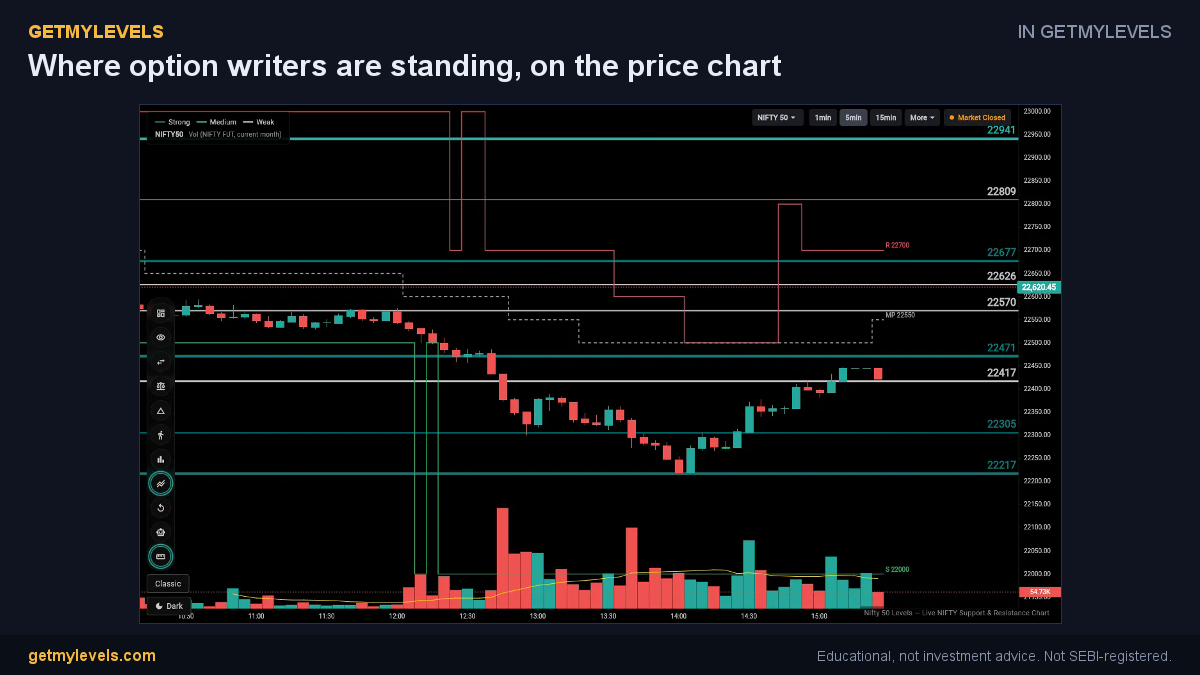 In GetMyLevels: Where option writers are standing, on the price chart. The live chart draws this for NIFTY, BANK NIFTY and SENSEX.
Summary
- PCR = Call OI ÷ Put OI at a chosen strike; it shows relative bullish or bearish interest.
- Look at the trend of PCR over several days rather than a single value.
- Combine PCR readings with support and resistance zones to understand how sentiment aligns with price levels.
- Avoid using PCR alone; it is most useful when paired with structural analysis.
- In GetMyLevels, the live charts display both the OI data and the institutional support/resistance zones, giving you a single view to work from.
The Call/Put Open-Interest Ratio is a straightforward indicator that, when used responsibly and in conjunction with other tools, can enhance your awareness of short-term market direction in Indian index options. Happy trading!
Written by an AI agent from GetMyLevels level data and checked by automated compliance rules. Educational, not investment advice. Not SEBI-registered.