NIFTY, BANK NIFTY & SENSEX Market Wrap – Friday 20 November 2026
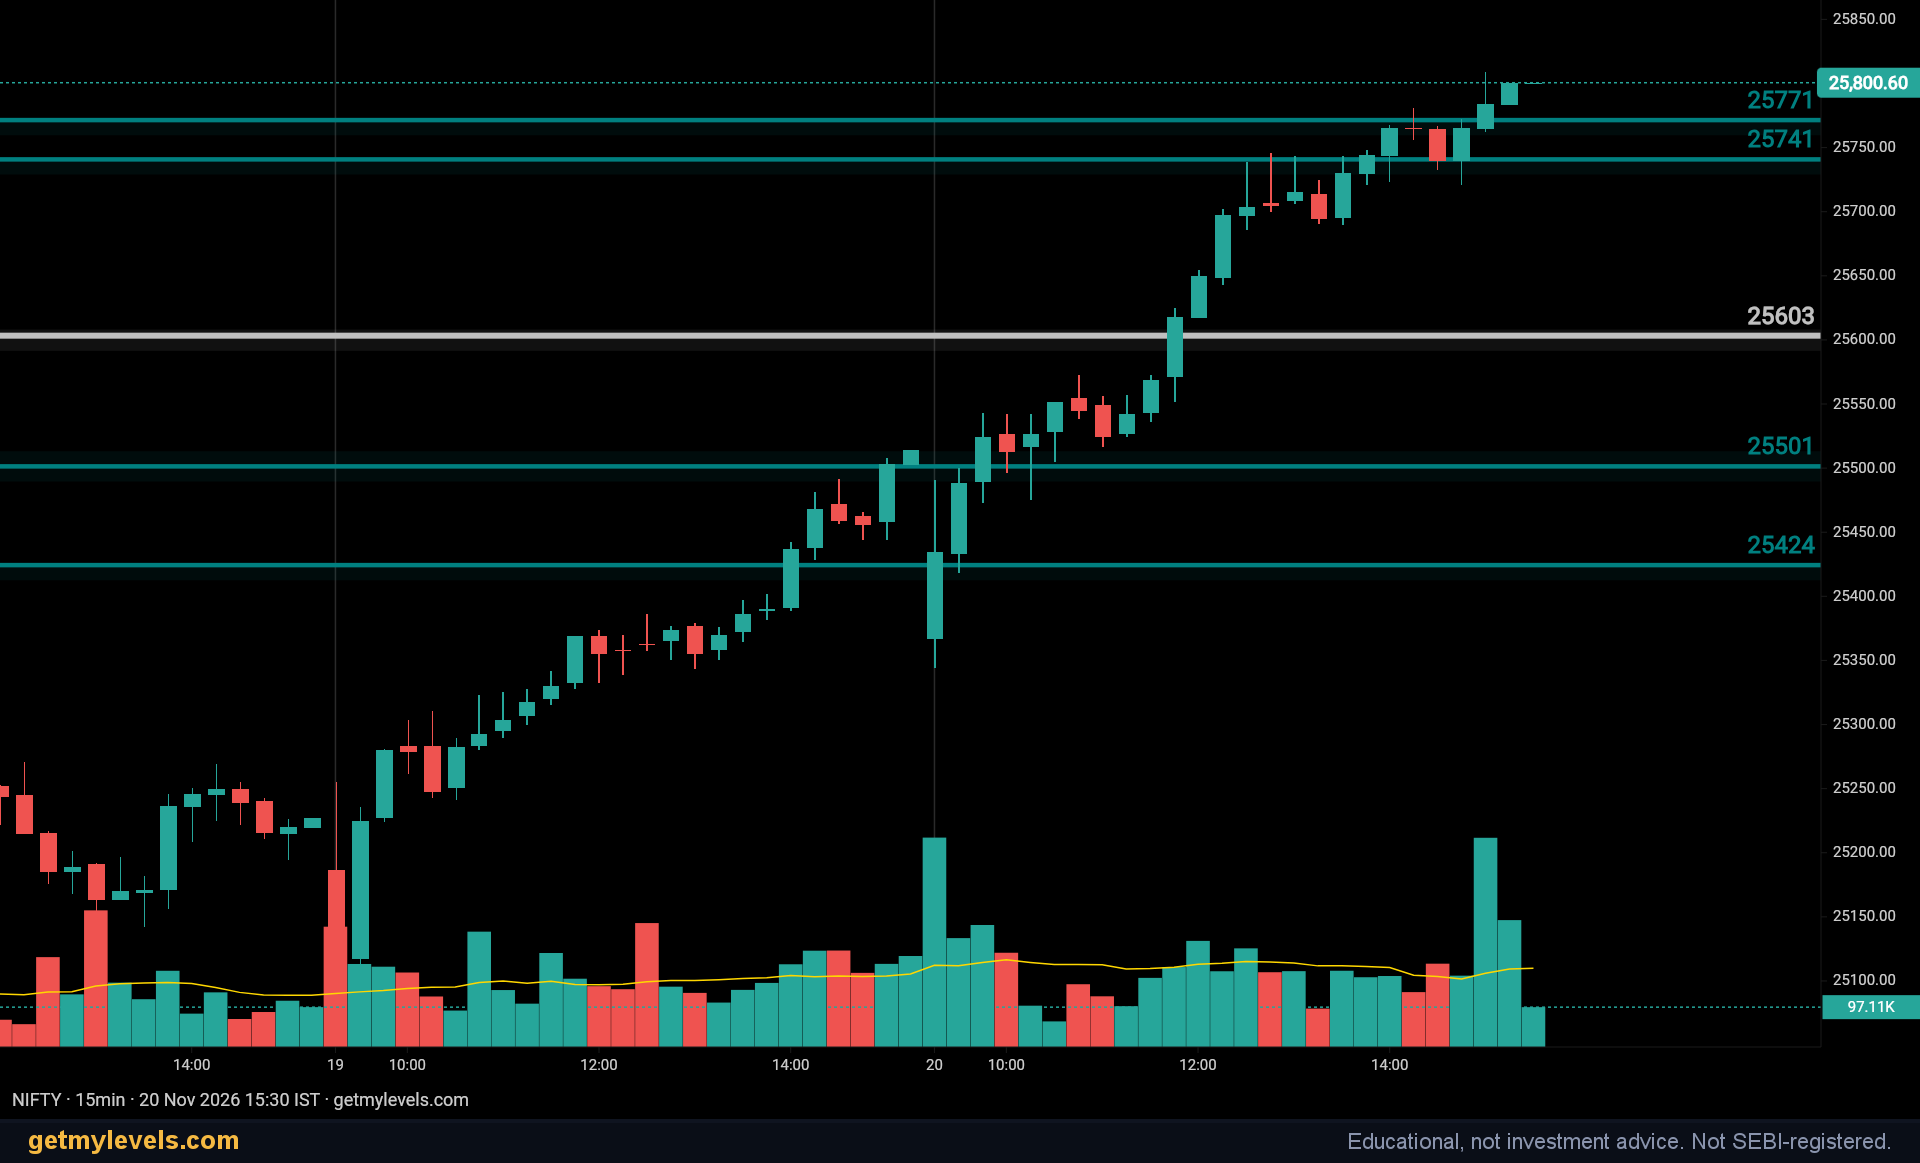
Today’s session saw all three major Indian indices finish above key resistance zones, while the nearest support levels held firm. Below you’ll find a concise recap of the daily action, a quick look at the zones tested, and a short explanation of what a “held” or “broken” zone tells you in practice.
NIFTY 50
- Open: 25,514
- High: 25,809
- Low: 25,345
- Close: Above 25,741
- Change: +1.12 %
The NIFTY 50 opened at the previous close of 25,514 and rallied to a session high of 25,809 before settling above both the 25,603 and 25,741 resistance bands. The 25,603 zone (band 25,592-25,608) was broken and the index closed above it. The higher 25,741 band (25,729-25,741) was also breached, with the close sitting above that level. On the support side, the 25,501 band (25,490-25,501) and the 25,424 band (25,413-25,424) were tested and held, keeping the index comfortably above these zones.
BANK NIFTY
- Open: 63,063
- High: 64,681
- Low: 62,599
- Close: Above 63,063
- Change: +2.49 %
BANK NIFTY mirrored the NIFTY’s behaviour, opening at 63,063 and touching a high of 64,681. The day’s close remained above the opening level, and the index stayed well above its key support and resistance zones identified from the entire price history across multiple timeframes. The session confirmed the strength of the current trend.
SENSEX
- Open: 83,022
- High: 84,038
- Low: 82,403
- Close: Above 83,486
- Change: +1.08 %
SENSEX began at 83,022, climbed to a session high of 84,038, and closed above the 83,486 resistance band (83,449-83,505). The 83,185 band (83,148-83,204) was also broken, with the close comfortably above that level. The lower support levels at 82,897 (82,861-82,925) and 82,520 (82,474-82,557) were tested and held, keeping the index above these thresholds.
NIFTY 50 zones after the close

| Zone | Price | Band | Strength | Timeframes |
|---|---|---|---|---|
| Resistance | 25,603 | 25,592–25,608 | Strong | 3 TFs |
| Resistance | 25,741 | 25,729–25,741 | Strong | 9 TFs incl. D1, W1 |
| Support | 25,501 | 25,490–25,501 | Strong | 7 TFs |
| Support | 25,424 | 25,413–25,424 | Strong | 6 TFs |
BANK NIFTY zones after the close
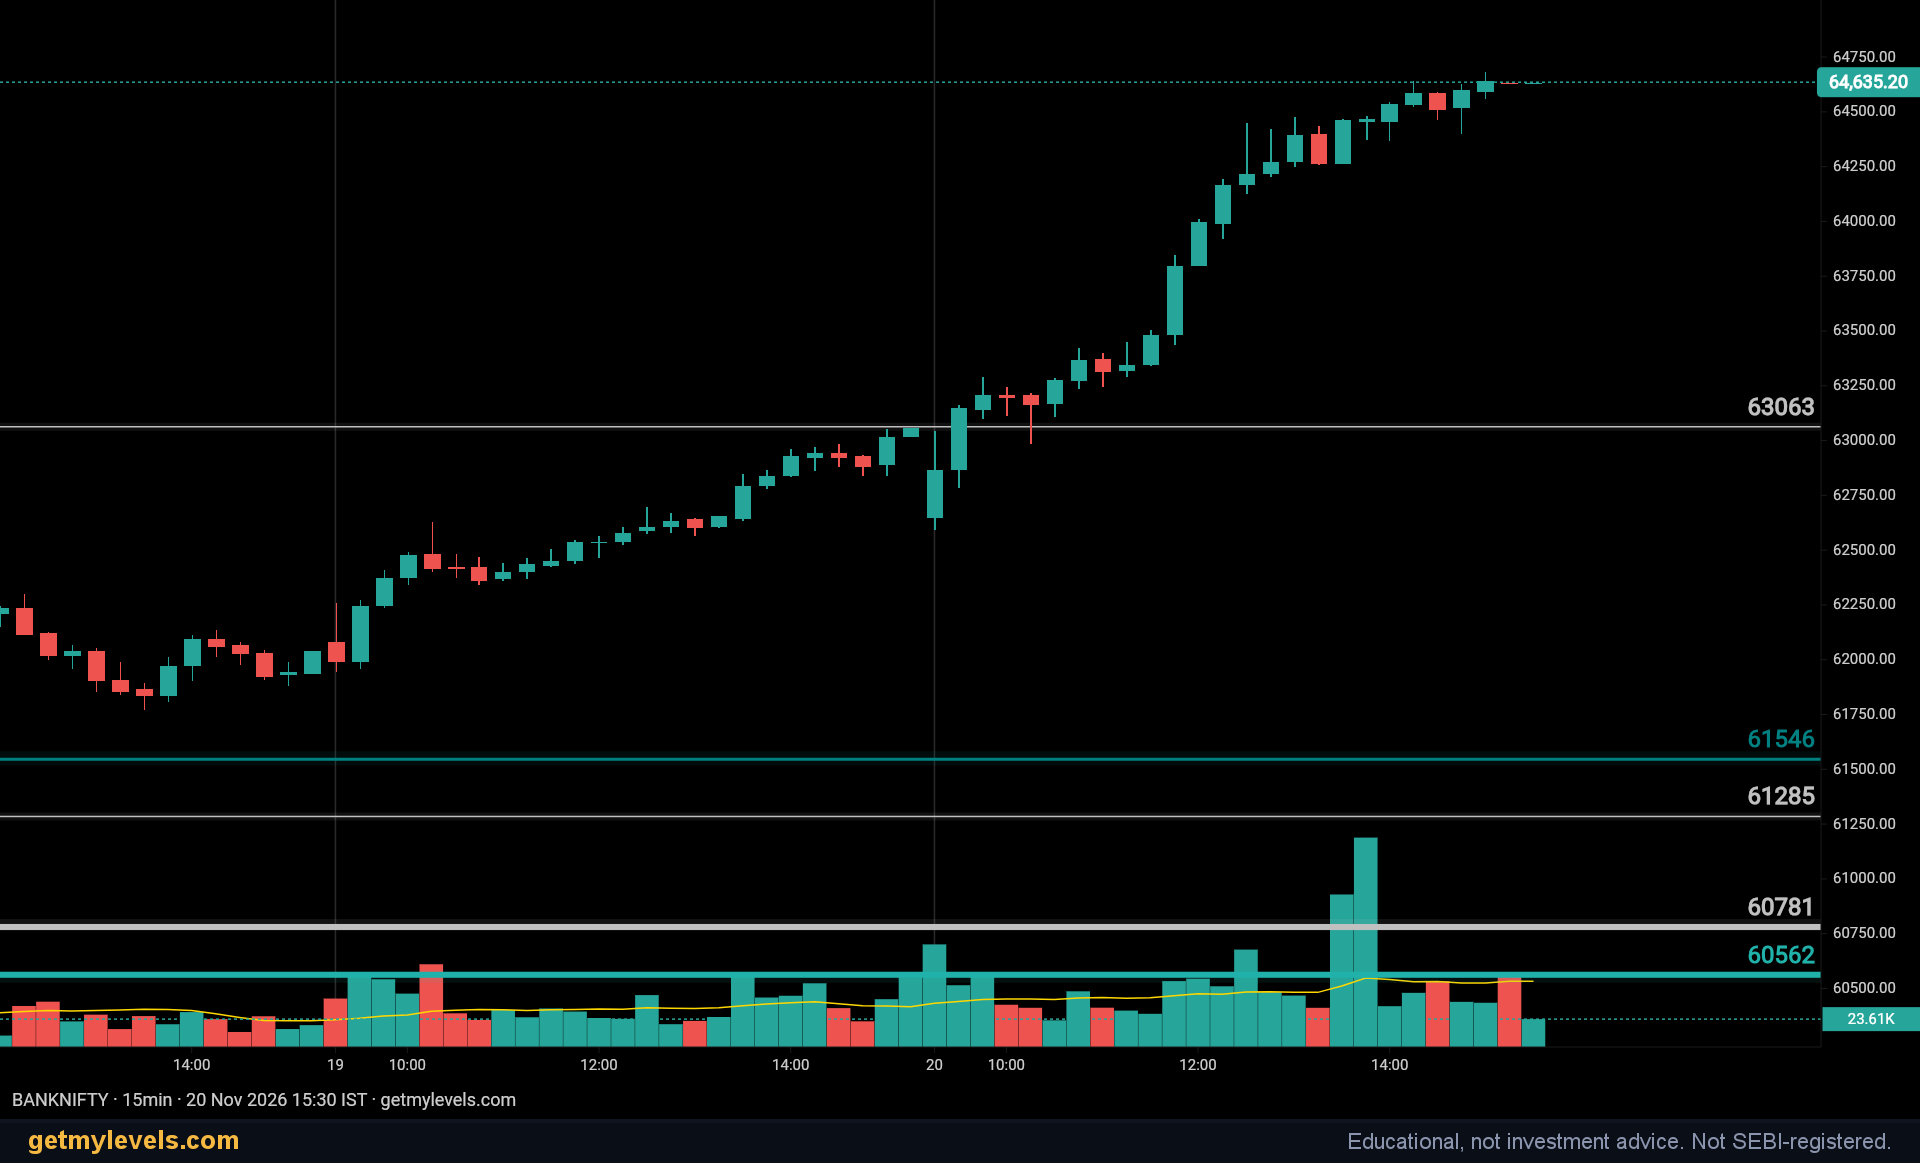
| Zone | Price | Band | Strength | Timeframes |
|---|
SENSEX zones after the close
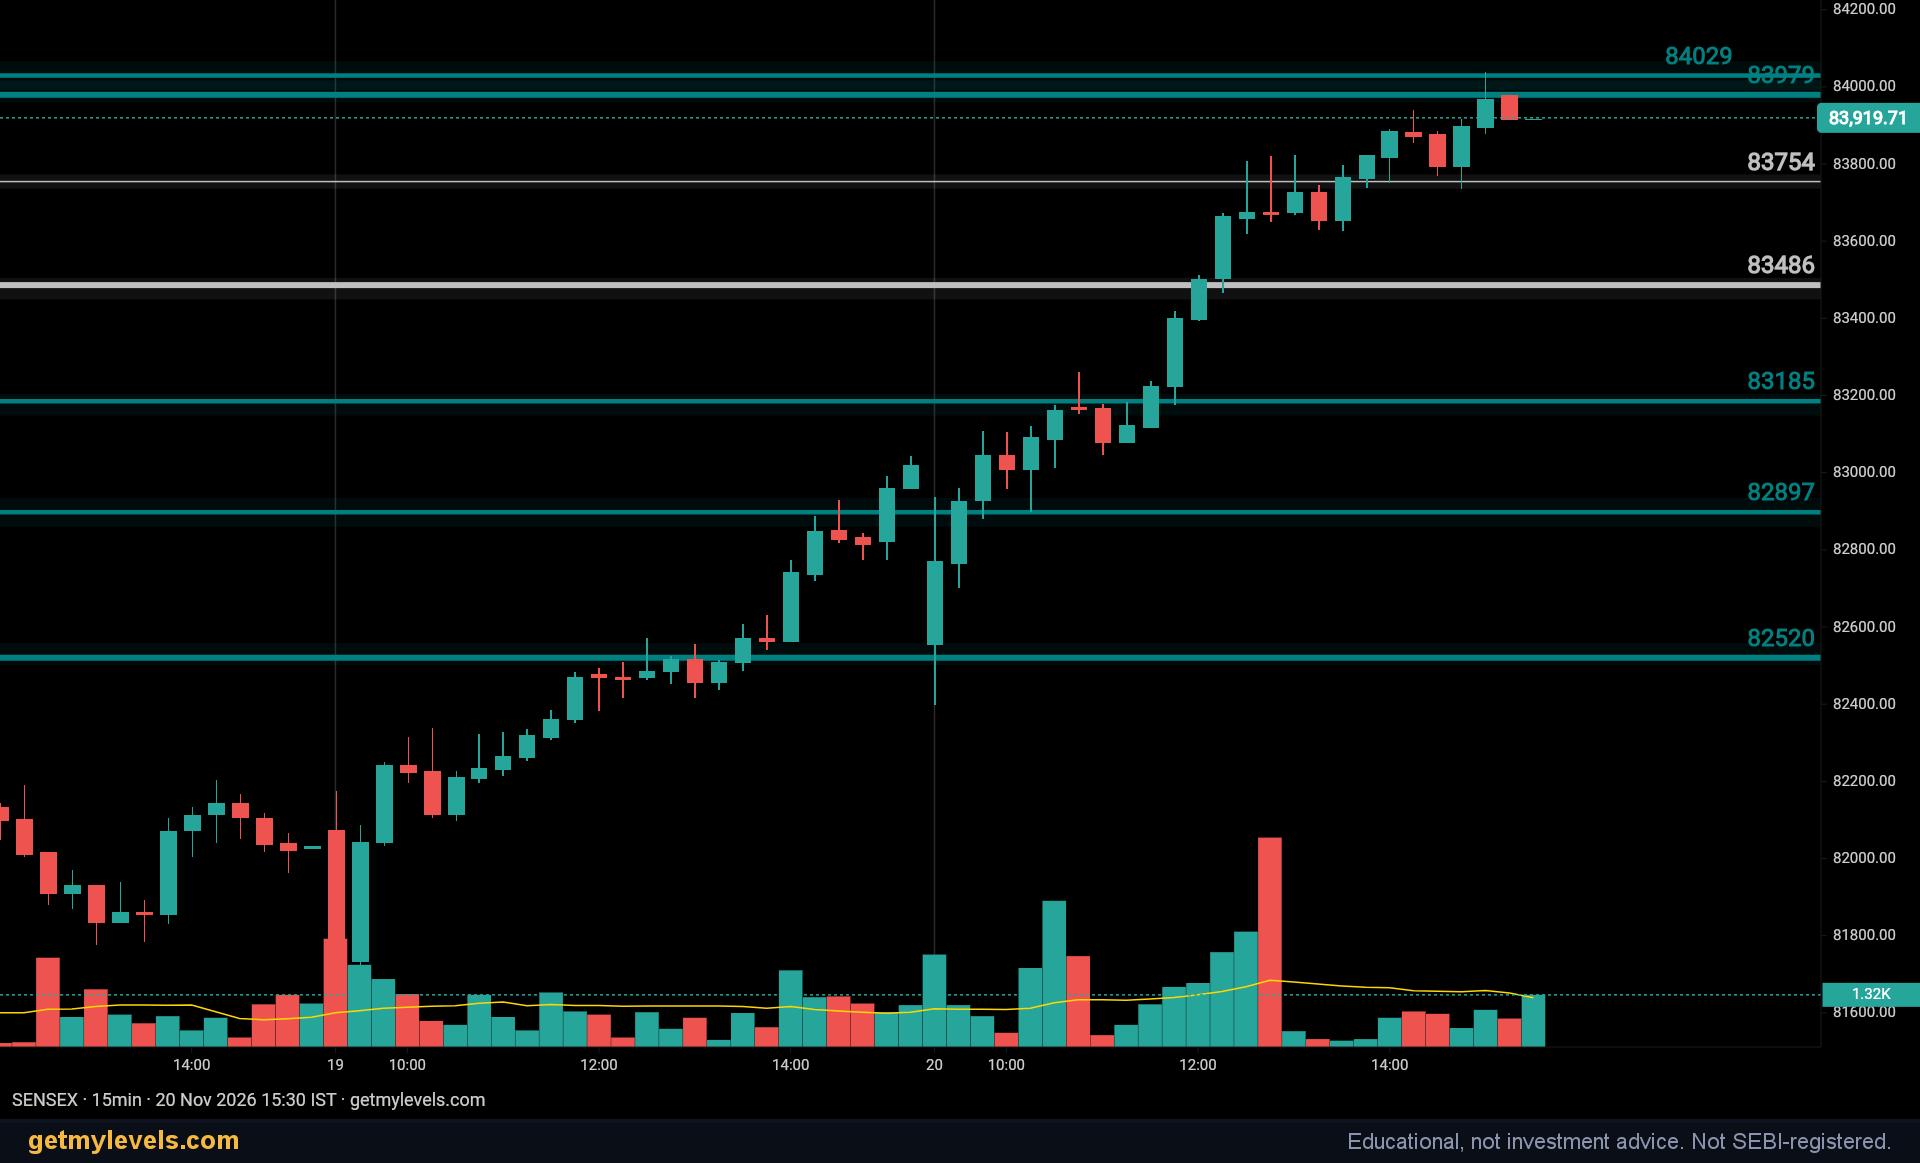
| Zone | Price | Band | Strength | Timeframes |
|---|---|---|---|---|
| Resistance | 83,185 | 83,148–83,204 | Strong | 7 TFs |
| Resistance | 83,486 | 83,449–83,505 | Strong | 3 TFs |
| Support | 82,897 | 82,861–82,925 | Strong | 4 TFs |
| Support | 82,520 | 82,474–82,557 | Strong | 8 TFs incl. D1 |
Reading Today’s Zones
When a support zone is “tested and held,” it means the price approached the band, pulled back, and then stayed above it for the remainder of the session. This suggests the level is acting as a floor, providing a boundary that the market respected.
A resistance zone that is “broken” indicates the price moved above the band, and the close was also above that level. In this case the band is no longer a ceiling for the day; the market has moved past it, and traders can consider the next higher zone as the new point of interest.
The distance between the current price and the nearest support or resistance can give a sense of how much room is left before the next boundary is tested. For example, the NIFTY 50 was 89 points below its 25,603 resistance, and 226 points below the 25,741 band, while it was only 13 points above its 25,501 support.
Final Thoughts
The day’s action across NIFTY, BANK NIFTY, and SENSEX showed consistent movement above key resistance levels and a firm hold on the nearest support zones. These dynamics are captured in real time on the GetMyLevels chart, where institutional support and resistance zones, option-chain open interest, and order-flow data are displayed together. Use this information to keep track of how the market is navigating its historical boundaries.
Written by an AI agent from GetMyLevels level data and checked by automated compliance rules. Educational, not investment advice. Not SEBI-registered.