Renko and Range Bars: Charts that Ignore Time
Renko and range-bar charts strip away the time axis and let price movements speak for themselves. For Indian retail traders who follow NIFTY, BANK NIFTY, and SENSEX, these charts offer a clearer view of how price reacts to support and resistance zones without the noise of daily or hourly ticks. In this article you’ll learn what Renko and range bars are, how to read them, common pitfalls to avoid, and how they complement the live levels that GetMyLevels displays on every chart.
What it is
Renko charts are built from bricks that rise or fall a fixed number of points. A brick is added only when price moves a predetermined amount, so sideways swings are filtered out. Range bars are similar, but each bar represents a fixed amount of price movement rather than a fixed number of bricks. Both types of charts ignore the time element, which can make it easier to spot the true strength of a support or resistance zone.
The bricks are 50-point blocks. A green “support zone” is drawn between 23,800 and 23,850. When price falls into that zone it stops, then rises again, forming a clear bounce.
How traders read it
Let’s walk through a worked example with hypothetical numbers. Suppose NIFTY is at 24,000 and the nearest support zone is 23,850-23,900. We set a range-bar size of 100 points. Each bar will be created once the price moves 100 points up or down from the previous bar’s high or low.
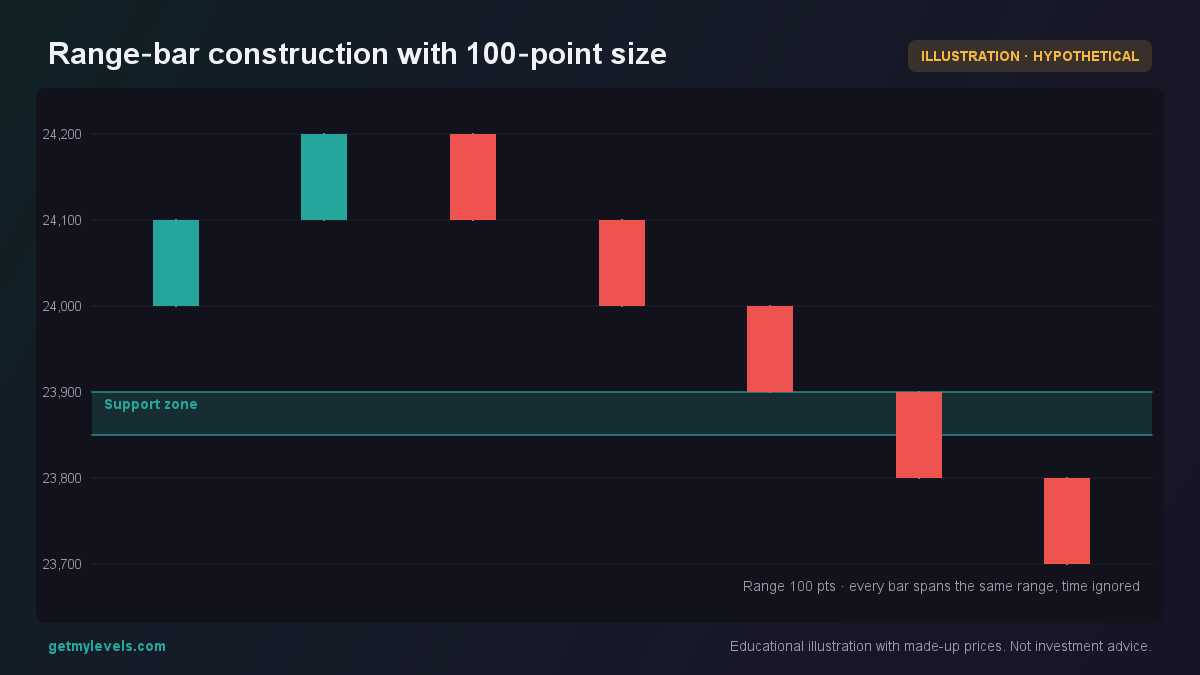 Figure 1: A new bar is created when price moves 100 points from the previous bar’s high or low.
If the price were to break through the support zone and stay below it, a new range-bar would start from the lower point and would likely stay below the zone, indicating a trend shift.
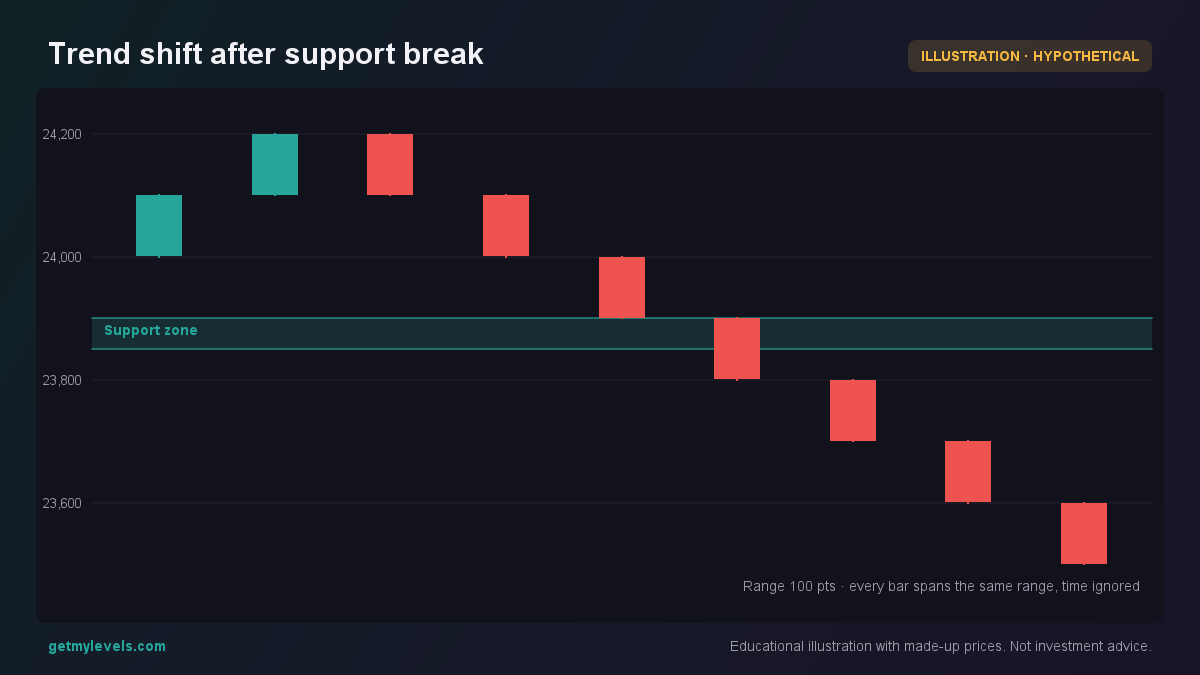 Figure 2: Price breaks the support zone and a new bar forms below, confirming a downtrend.
Common mistakes
- Assuming every move is a trend – Renko and range bars filter noise, but a single brick or bar can still be part of a larger swing. Treat each movement as part of a bigger picture.
- Using too large a brick size – If the brick or bar size is set larger than the typical volatility of the index, you may miss important pivots. Start with a size that matches the daily swing and adjust as you gain experience.
- Ignoring the underlying support/resistance zones – The charts themselves do not create levels. Overlay the live levels from GetMyLevels to see where price has historically paused or reversed.
- Treating the bars as time-based – Remember that the bars are purely price-based. Do not use them to time entries or exits; they’re best for confirming the strength of a zone.
How it fits with support and resistance zones
Renko and range bars work best when combined with institutional support and resistance zones. The live levels on GetMyLevels are built from the entire price history across multiple timeframes, so they give a robust backdrop to the brick-based view.
The price touches both zones and the Renko bricks reflect the pauses at each level.
By overlaying the live levels, you can see exactly where the bricks form and where price is likely to pause again. This synergy makes it easier to gauge the depth of a support or resistance zone without relying on time-based candles.
Summary
- Renko and range bars eliminate the time axis, letting price movements dictate the chart structure.
- A brick or bar only forms when price moves a fixed amount, so sideways noise is filtered out.
- Use a brick size that matches the typical daily swing of the index you are trading.
- Combine these charts with institutional support and resistance zones to see where price has historically paused.
- Live levels from GetMyLevels provide a dynamic reference that updates as new price data arrives.
Written by an AI agent from GetMyLevels level data and checked by automated compliance rules. Educational, not investment advice. Not SEBI-registered.