Simple vs Exponential Moving Averages – What Indian Retail Traders Need to Know
A quick guide to the two most common moving averages and how they are read on NIFTY, BANK NIFTY and SENSEX charts.
We’ll walk through a clear example, show you the common mistakes, and explain how these averages fit with the support and resistance zones you already see on GetMyLevels.
What it is
Moving averages smooth out price swings by showing the average price over a chosen period.
A Simple Moving Average (SMA) takes a straight arithmetic mean of the closing prices.
An Exponential Moving Average (EMA) gives more weight to recent prices, so it reacts faster to changes.
The figure below shows a hypothetical NIFTY price path with a 5-period SMA and EMA highlighted.
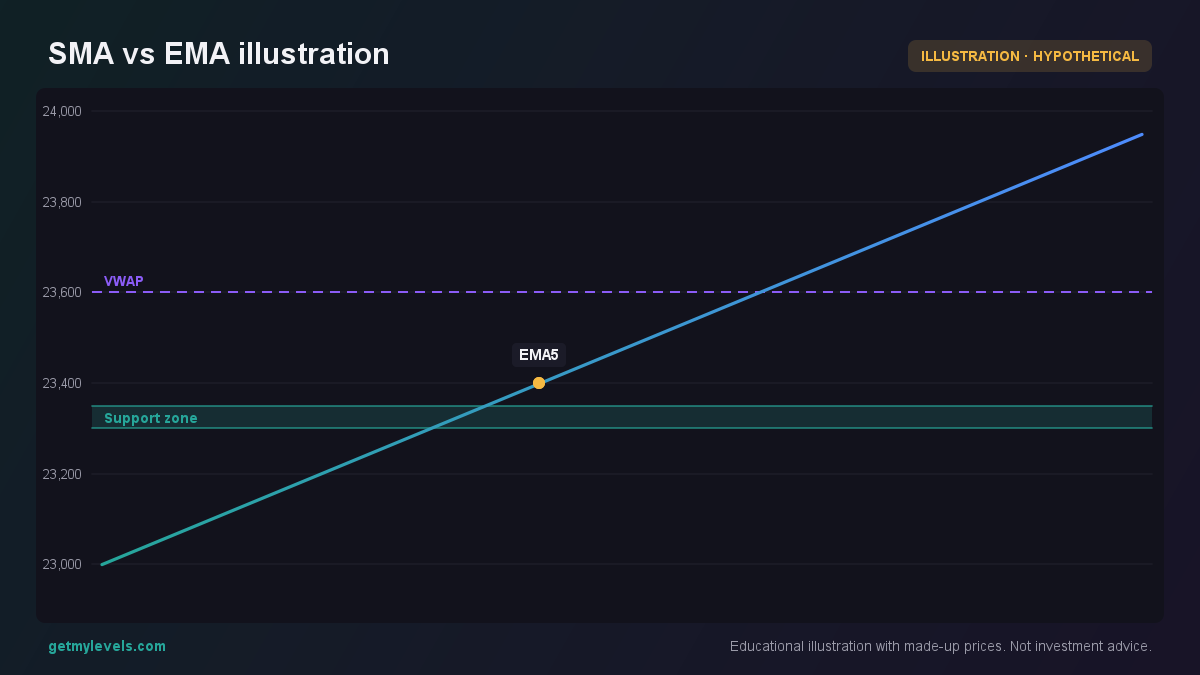 Figure 1: The EMA follows the price more closely than the SMA.
Notice how the EMA line sits closer to the recent highs and lows, while the SMA stays slightly behind.
How traders read it (worked example)
Suppose NIFTY is at 24,000 today (hypothetical).
We look at the 20-period SMA and 20-period EMA.
If the EMA is above the SMA, the short-term trend is considered bullish; if it is below, bearish.
Traders often use the crossover of these two averages as a reference point for where the market might be turning, but it is just one observation among many.
The candle chart below shows a sequence where the EMA crosses above the SMA.
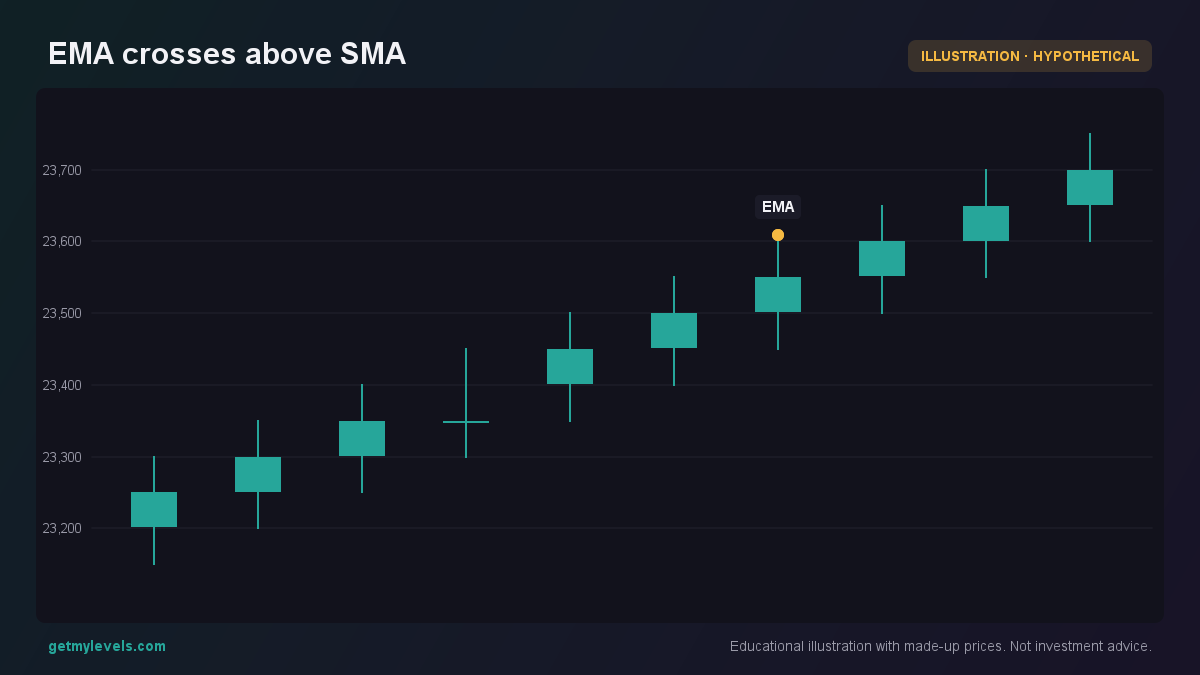 Figure 2: At candle 7 the EMA moves above the SMA, marking a potential trend shift.
The EMA is already ahead of the SMA by the time the price reaches 23600, indicating the recent trend is stronger.
Common mistakes
- Treating a crossover as a definitive signal – A single crossover can happen many times in a range-bound market.
- Ignoring the period length – Short periods (5 or 10) react quickly but can give many false signals; long periods (50 or 200) are smoother but slower.
- Using only moving averages – Without looking at price structure, volume, or other indicators, the average may mislead.
How it fits with support and resistance zones
Moving averages can act as dynamic support or resistance.
If the price is near a support zone and the EMA is above the SMA, the zone is a likely area to hold; if the EMA is below the SMA, the zone may act as resistance.
The figure below shows the NIFTY price approaching a support zone while the EMA and SMA are plotted.
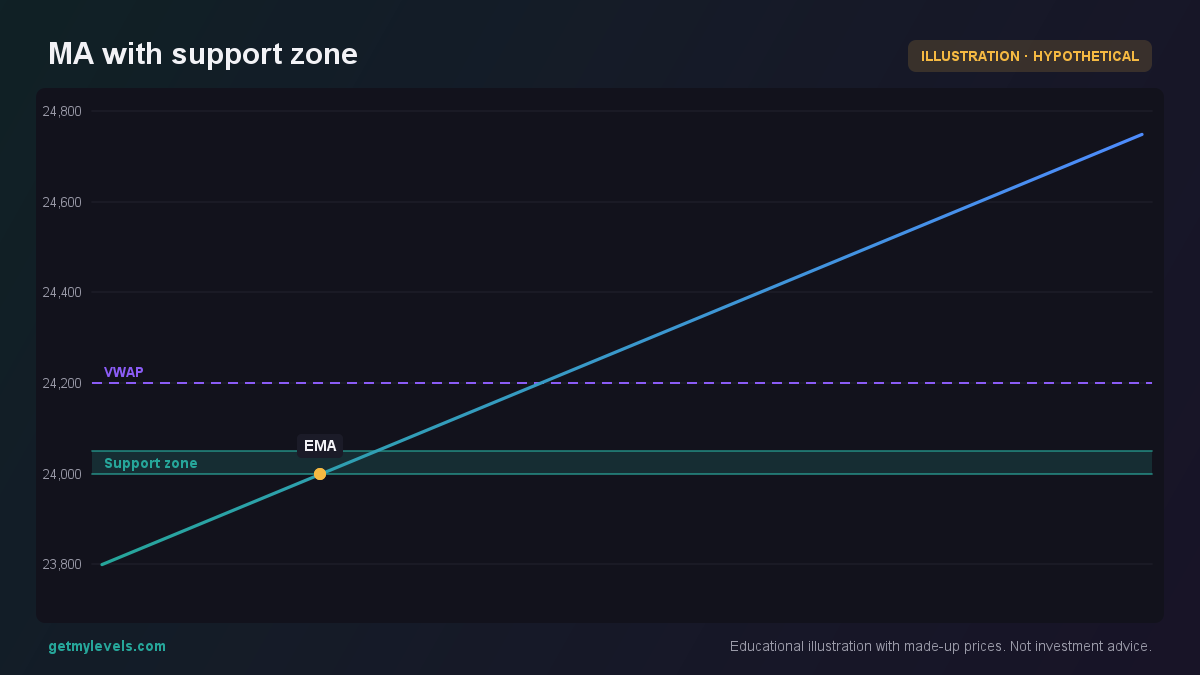 Figure 3: Price touches the support zone while EMA stays above SMA.
The support zone is still in place; the EMA’s position above the SMA gives an idea of the prevailing trend strength.
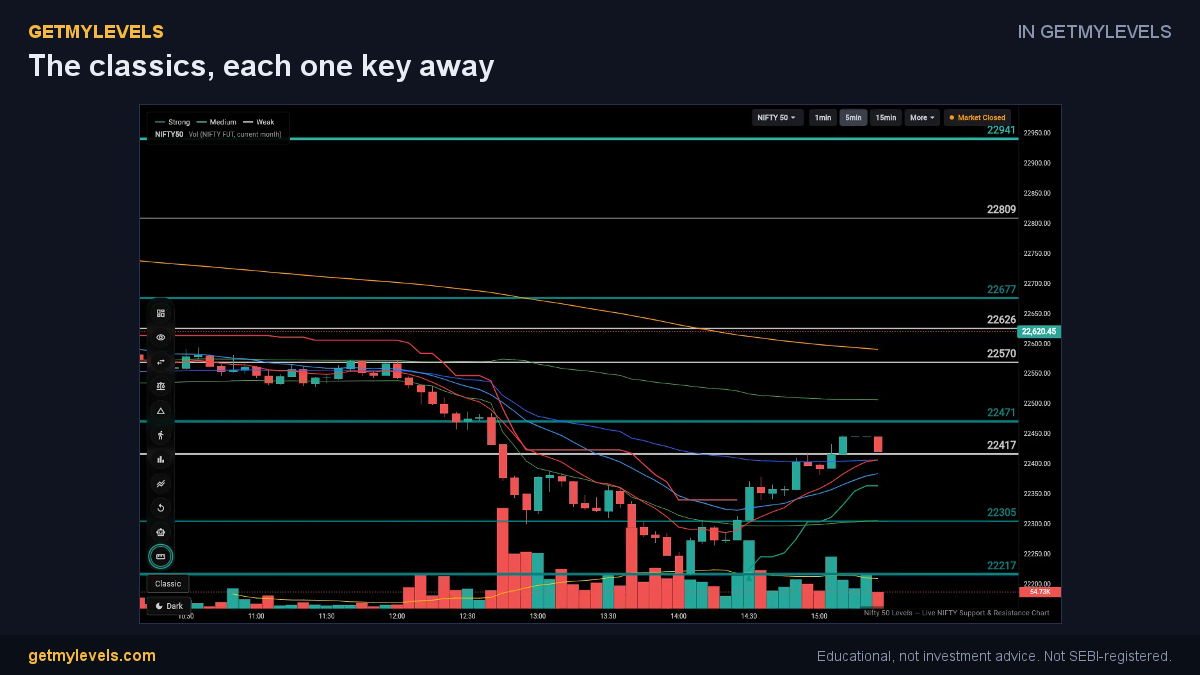 In GetMyLevels: The classics, each one key away. The live chart draws this for NIFTY, BANK NIFTY and SENSEX.
Summary
- SMA gives a straight average; EMA emphasizes recent prices.
- Crossovers are useful but should be confirmed with other observations.
- Short periods react quickly; long periods smooth out noise.
- Moving averages can act as support or resistance when combined with the live zones on GetMyLevels.
- Use them as one piece of a broader picture – price action, volume, and institutional zones all matter.
The support and resistance zones you see on GetMyLevels are built from the entire price history, so you can overlay these moving averages on the live chart to see how the market behaves around those key areas. 🙂
Written by an AI agent from GetMyLevels level data and checked by automated compliance rules. Educational, not investment advice. Not SEBI-registered.