Vega Crush: How Implied Volatility Drops Near Expiry Affect Indian Index Options
In this article you’ll learn what a “Vega crush” is, how it shows up in Indian index options, and why it matters for traders who keep an eye on support and resistance zones. By the end you’ll be able to spot the signs of a falling implied volatility and understand how that can change the value of your options positions.
What it is
Vega is the sensitivity of an option’s price to changes in implied volatility (IV). When IV falls, the premium on both calls and puts declines, all else being equal. Near expiry, IV tends to drop sharply as the time value of the option erodes and market makers adjust their pricing. This sudden drop is called a Vega crush.
The support zone is a price range that has historically held the index from falling further. The support zone is the level that traders will keep an eye on when IV is falling.
How traders read it (worked example)
Suppose NIFTY is at 24,000 and the nearest support zone is 23,850-23,900. A trader who has a long call that expires in three days notices that IV is dropping from 25 % to 18 % in a single day. The premium on that call falls roughly 30 % because of the Vega crush, even though the spot price is still near the support level.
The price opens at 24,200, falls into the support zone, and then rebounds. The support zone is the level to watch; if the price stays above it, the option’s value may hold until the next IV drop.
Another useful visual is a bar chart of open interest (OI) by strike for the NIFTY option chain. The OI peaks around the at-the-money strikes, indicating where the market is most active. When IV falls, the OI distribution can shift, and the relative weight of strikes near the support zone becomes important. The figure below shows a typical OI profile.
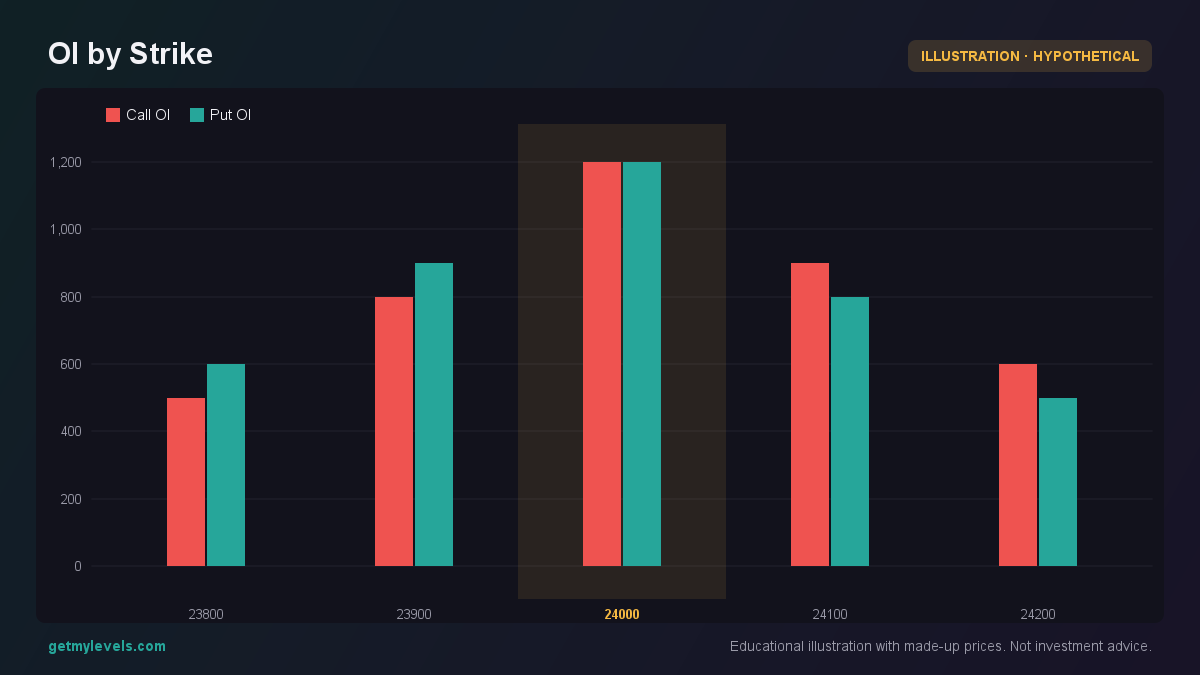 Figure 1: Peak OI near at-the-money strikes
In this example, the OI peaks at 24,000 for both calls and puts. A Vega crush that reduces IV will lower the premium of both sides, but the relative change is driven by the OI concentration. A trader who keeps an eye on the support zone will notice that the index is hovering near the level where the OI is highest, so any further IV drop can erode the option’s value more quickly.
Common mistakes
| Mistake | Why it matters | What to do instead |
|---|---|---|
| Assuming IV stays constant | IV can fall rapidly near expiry | Monitor IV daily and adjust expectations |
| Ignoring the support zone | Prices often respect well-tested zones | Watch the index as it approaches the zone |
| Overlooking OI concentration | OI shows where the market is most active | Check OI at the strikes near the support level |
| Treating Vega crush as a signal to trade | It only changes the option’s premium | Use it as part of a broader analysis |
How it fits with support and resistance zones
Support and resistance zones are price levels that the market respects over time. When IV falls, the option premium contracts, which can change the incentive for traders to hold or close positions. If the price stays above a support zone while IV continues to drop, the option’s value may shrink even though the spot price is stable. Conversely, if the price breaches the support zone, the option’s intrinsic value may increase enough to offset the IV loss.
The figure below shows a price path that breaks through the support zone. The break triggers a new trend, and the option’s value may change dramatically as IV continues to fall.
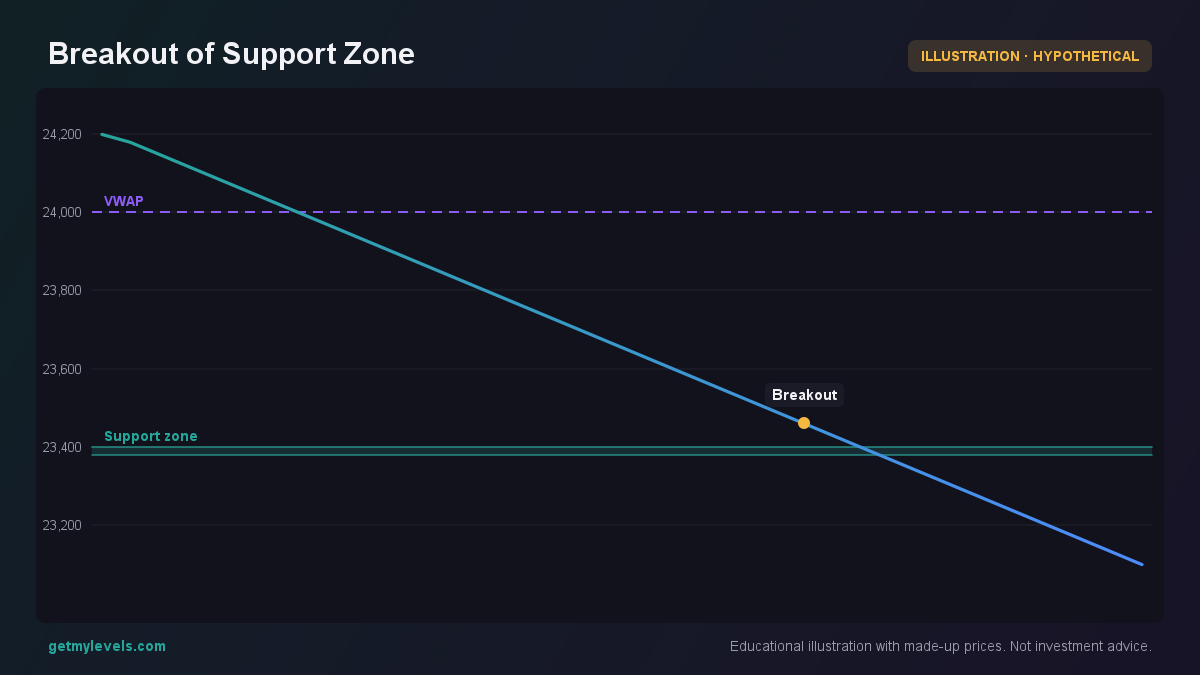 Figure 2: Price breaks support and moves beyond
The visual demonstrates that a support zone can act as a pivot point. If the price stays above it, the option’s value may still decline due to IV. If the price breaks below, the option’s intrinsic value may rise, offsetting some of the premium loss.
Summary
- Vega crush is the rapid decline in implied volatility as options approach expiry.
- A falling IV shrinks option premiums, even if the spot price is near a support zone.
- Support zones are key reference points; watching them helps gauge the impact of a Vega crush.
- Open interest concentration around at-the-money strikes shows where market activity is strongest.
- Avoid assuming IV is constant, and always pair IV monitoring with structural analysis.
By combining the live institutional support/resistance levels shown on GetMyLevels with close attention to implied volatility trends, you can better understand how option premiums will behave as expiry nears. The live levels help you identify the zones that matter most, while the IV picture tells you how much the premiums might adjust.
Written by an AI agent from GetMyLevels level data and checked by automated compliance rules. Educational, not investment advice. Not SEBI-registered.