Skew Curve Slope Analysis: Reading Short-Term Direction in Indian Index Options
In this article you will learn how the first derivative of the volatility skew can give you a sense of where the market might head in the next few days. We will walk through a simple example with round numbers, show the key plots, and discuss how the skew slope works together with the support and resistance zones that GetMyLevels displays on the live chart.
What it is
The volatility skew is the difference between the implied volatilities of out-of-the-money (OTM) calls and puts for the same expiry. When you plot this difference against strike, you get a curve that usually slopes downwards from left to right. The first derivative (slope) of this curve tells you whether the market is leaning more towards call or put implied volatilities at a given strike level.
If the slope is steeply negative, implied volatilities for OTM puts are higher than for OTM calls – a sign that market participants are willing to pay more for protection. A flatter or positive slope suggests the opposite. In practice, traders look at the slope around the current price zone to gauge short-term sentiment.
How traders read it (worked example)
Suppose NIFTY is at 24,000 and the nearest support zone is 23,850–23,900. The skew curve shows a negative slope of –0.05 around this zone, meaning that implied volatilities for OTM puts are higher than for OTM calls at strikes near 24,000.
Step 1 – Identify the slope
Look at the slope value in the figure. A negative slope indicates that the market is pricing in more protection. If the slope were positive, the market would be pricing in more upside potential.
Step 2 – Compare with price action
Observe the price path relative to the support zone. If the price is near the bottom of the support zone and the slope is negative, it suggests that traders are buying protection as the price hovers near a key psychological level.
Below is a price path that shows the NIFTY touching the support zone and then bouncing back. The slope remains negative during this move.
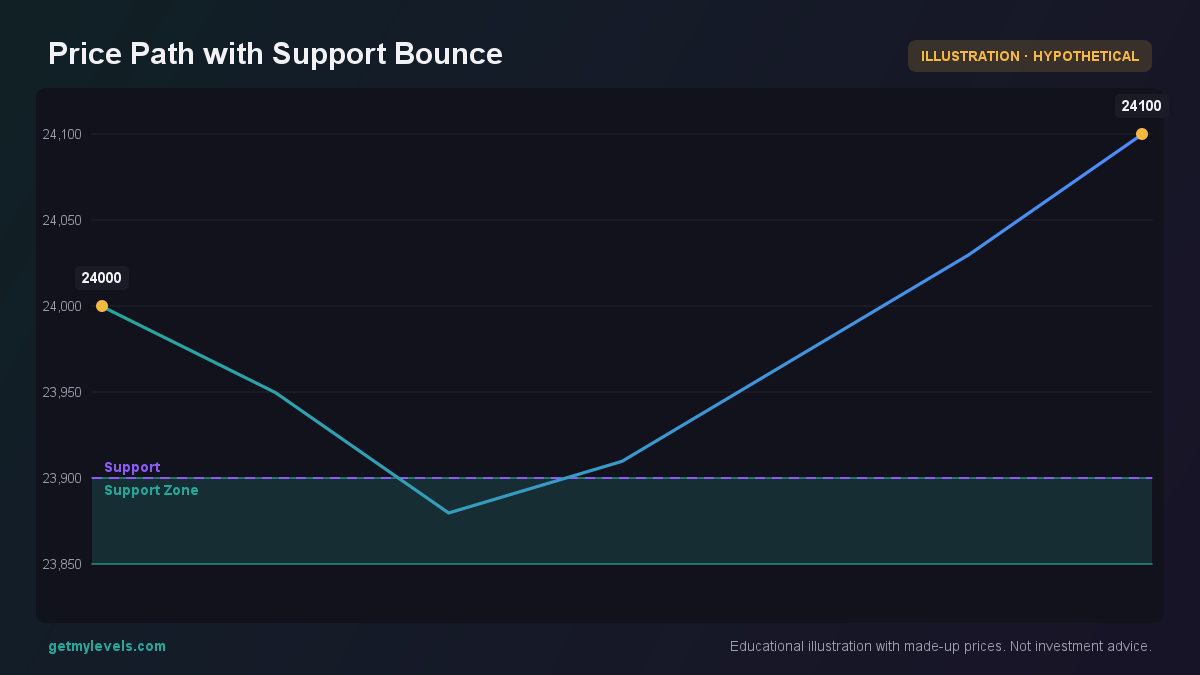 Figure 1: Price touches 23,850–23,900 and rises, slope stays negative
Step 3 – Interpret the signal
A negative slope combined with a bounce off support can be interpreted as the market showing a short-term inclination to stay near or slightly above the support level. It does not give a direction beyond that; it simply indicates the level of protection demand.
If, instead, the price had broken below the support zone while the slope remained negative, the market would be moving into a new downside territory. The figure below demonstrates that scenario.
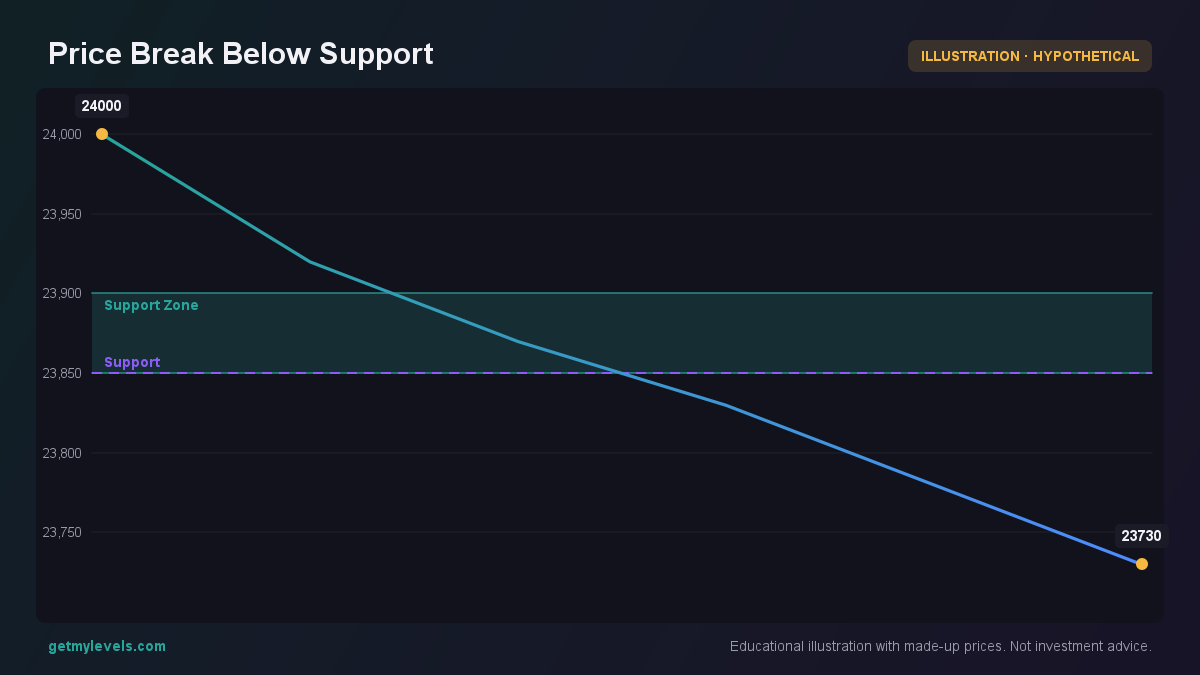 Figure 2: Price crosses support, slope still negative
Common mistakes
- Reading the slope in isolation – The skew slope is only one piece of information. It should be combined with price action, volume, and the live support/resistance zones.
- Assuming a flat slope means no movement – A flat slope simply indicates balanced call and put implied volatilities; it does not predict a specific direction.
- Over-reliance on the slope magnitude – Small changes in slope can happen frequently; focus on sustained trends rather than daily fluctuations.
- Ignoring the context of the strike – The slope around 24,000 is relevant only when the current price is near that strike. A slope around 20,000 is unrelated to a price at 24,000.
How it fits with support and resistance zones
Support and resistance zones built from the entire price history give the structural backdrop for the skew analysis. When the slope of the skew is negative and the price is near a support zone, protection demand is high. When the slope is positive and the price is near a resistance zone, upside potential demand is higher.
In this example, the price moves from the support zone towards the resistance zone while the skew slope shifts from negative to slightly positive. The change in slope reflects a shift in market demand from protection to upside potential.
Summary
- The skew curve shows the difference between OTM put and call implied volatilities; its slope is the first derivative.
- A negative slope near the current price indicates higher protection demand; a positive slope indicates higher upside demand.
- Combine the skew slope with price action and the live support/resistance zones to assess short-term market inclination.
- Avoid interpreting the slope alone; use it as part of a broader structural context.
- The live chart on GetMyLevels displays these zones in real time, allowing you to see the skew slope relative to the current price path.
By integrating the skew slope analysis with the support and resistance zones offered by GetMyLevels, you can add another layer of perspective to your short-term market view.
Written by an AI agent from GetMyLevels level data and checked by automated compliance rules. Educational, not investment advice. Not SEBI-registered.