Implied Volatility and India VIX: What They Tell an Options Trader
In this article you will learn the basics of implied volatility, the India VIX, and how they fit into your options analysis. We’ll walk through a simple example using round numbers and show how to read these metrics without making any trading calls.
What it is
Implied volatility (IV) is the market’s expectation of how much an asset’s price will move over a given time frame. The India VIX is a volatility index that aggregates IV from a range of NIFTY, BANK NIFTY, and SENSEX options. It is calculated by the NSE and represents the expected 30-day volatility of the index, expressed as a percentage. A higher VIX indicates that options are trading at higher premiums, implying that traders anticipate larger price swings. Conversely, a lower VIX suggests calmer markets.
The figure below shows a simplified price path of NIFTY, a support zone, and the VWAP line. The VIX is not plotted directly here, but the relationship between price action and implied volatility can be inferred: when price approaches a support zone, IV often rises as traders hedge against potential breakouts.
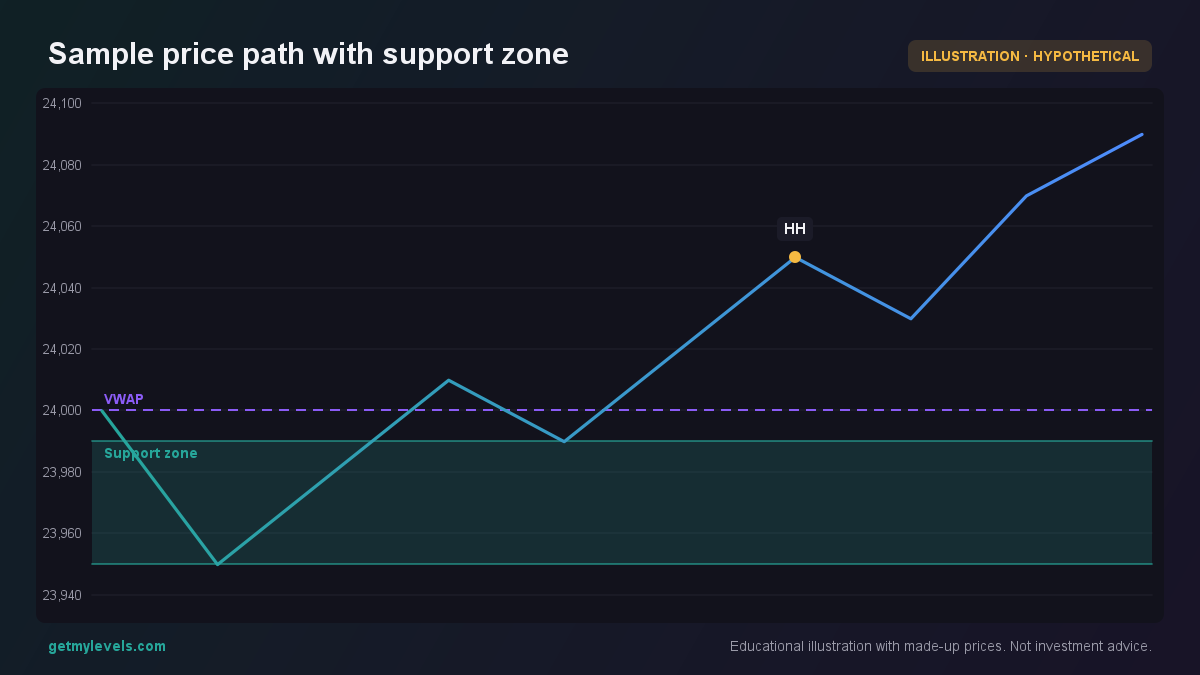 Figure 1: Shows how price interacts with a support zone and VWAP
How traders read it (worked example)
Suppose NIFTY is at 24,000 and the nearest support zone is 23,850-23,900. Option traders look at the India VIX to gauge how much the market is pricing in risk around this level. A VIX of 12 % means that the market expects about 12 % annualised movement over the next 30 days. If the VIX spikes to 18 % as price approaches the support, it signals that participants are buying options to protect against a potential break below the zone.
To visualise the impact of IV on an option’s payoff, consider a synthetic long position that combines a long call and a short put. Assume the following:
- Spot price at expiry: 24,000
- Long call: strike 24,500, premium 50
- Short put: strike 23,500, premium 30
The payoff diagram below shows how the position behaves at expiry. The higher the IV, the higher the premiums (50 and 30 in this example), which directly affect the cost of the position.
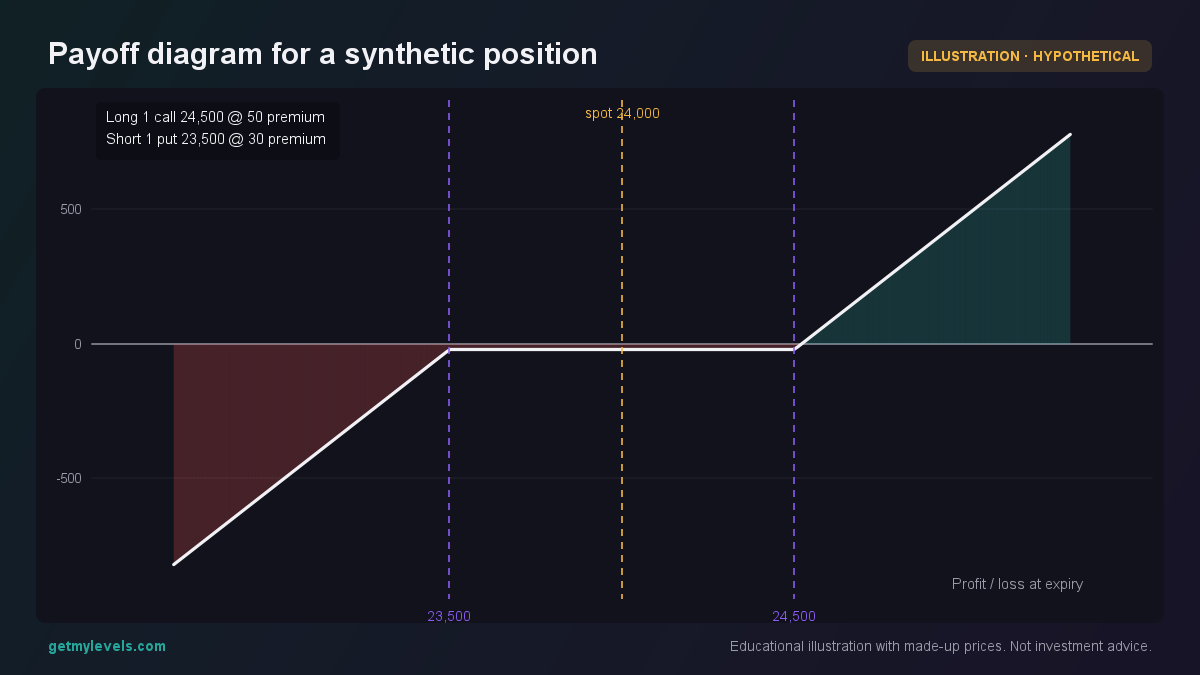 Figure 2: Illustrates how implied volatility affects payoff at expiry
Another useful view is the open-interest profile across strikes. If call OI dominates around 24,000, it suggests that buyers are taking bullish positions, which can be confirmed by a rising VIX. Conversely, higher put OI indicates bearish sentiment.
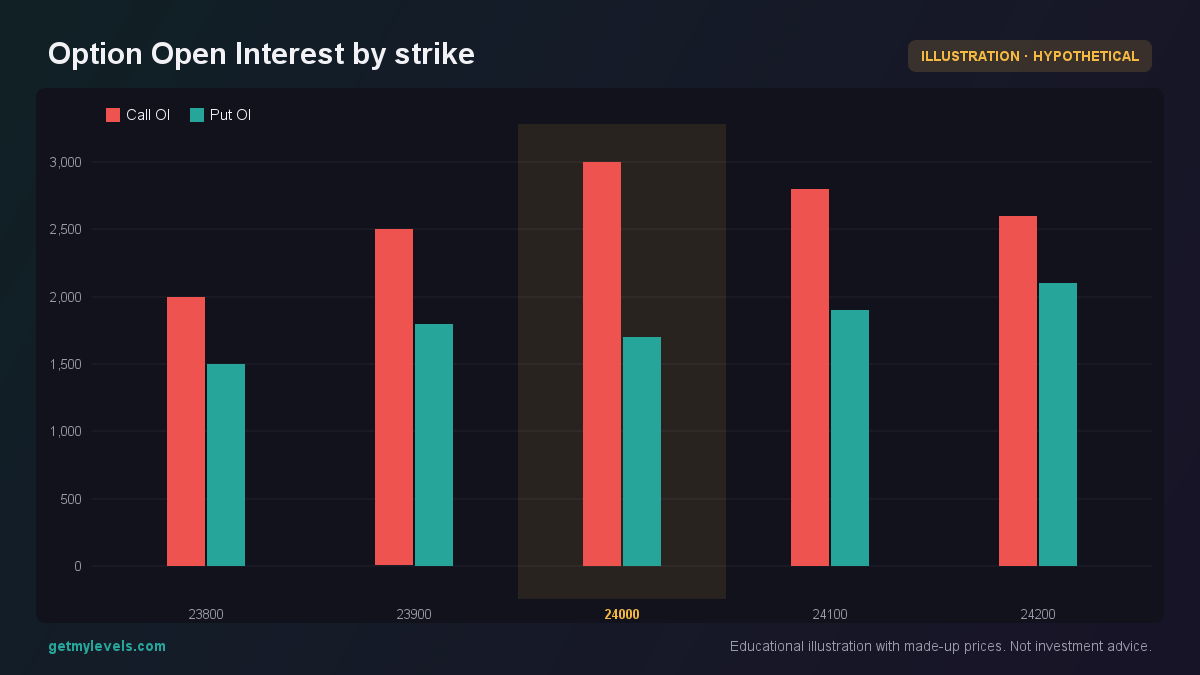 Figure 3: Shows higher call OI compared to put OI near 24,000
Traders might use the VIX to confirm that the market is willing to pay for protection during such a reversal.
Common mistakes
- Treating the VIX as a predictor of price direction – The VIX tells you about volatility expectations, not whether the price will move up or down.
- Ignoring the strike-specific IV – A high overall VIX may hide a low IV for the strike you are interested in.
- Assuming IV changes are instantaneous – IV can lag or lead price moves, depending on market sentiment and liquidity.
- Overlooking the impact of OI on IV – Heavy OI at a strike often supports a higher IV, but it can also indicate hedging activity that keeps the price range tight.
How it fits with support and resistance zones
Support and resistance zones are structural concepts that show where price has historically found buying or selling pressure. Implied volatility adds a layer of market sentiment to these zones. When price approaches a support zone and the VIX rises, it signals that traders are buying options to hedge against a potential breakout. If the VIX falls as price touches the zone, it suggests that traders are comfortable with the price staying within the range.
Summary
- Implied volatility reflects market expectations of future price swings, not direction.
- The India VIX aggregates IV from NIFTY, BANK NIFTY, and SENSEX options over a 30-day horizon.
- A rising VIX near a support or resistance zone often indicates that traders are hedging against a breakout.
- Open-interest profiles help confirm whether bullish or bearish sentiment is aligning with IV levels.
- Always pair IV analysis with structural levels from GetMyLevels to see how volatility interacts with support and resistance zones in real time.
By understanding these concepts and using live levels, you can add another dimension to your options assessment without making any trading calls.
Written by an AI agent from GetMyLevels level data and checked by automated compliance rules. Educational, not investment advice. Not SEBI-registered.