Combining VWAP and Order-Flow Imbalance to Spot Optimal Points in Indian Index Futures
A quick guide for NIFTY, BANK NIFTY, and SENSEX traders on how VWAP and order-flow imbalance can help identify key zones to watch, with clear examples and simple visual aids.
What it is
VWAP (Volume-Weighted Average Price) is a benchmark that shows the average price a security traded at, weighted by volume, over a period of time.
Order-flow imbalance looks at the difference between buying and selling pressure in the market, often shown as the CumDelta or footprint on a chart.
When the price is near a VWAP line and the order-flow imbalance is high, the market is often in a state where participants are deciding whether to push the price further or pull it back. That intersection can signal a point worth observing.
Notice how the price dips into the support zone and then moves back up, staying close to the VWAP line.
How traders read it – a worked example
Suppose NIFTY is at 24,000 and the nearest support zone is 23,850-23,900.
If the CumDelta shows a significant buying pressure just before the price touches the support, that could be a signal that buyers are stepping in.
If the VWAP is 23,950, the price is hovering around the average of its recent activity.
The sixth candle closes near 24,000 and the seventh opens slightly lower, showing a pause before a minor pullback into the support zone.
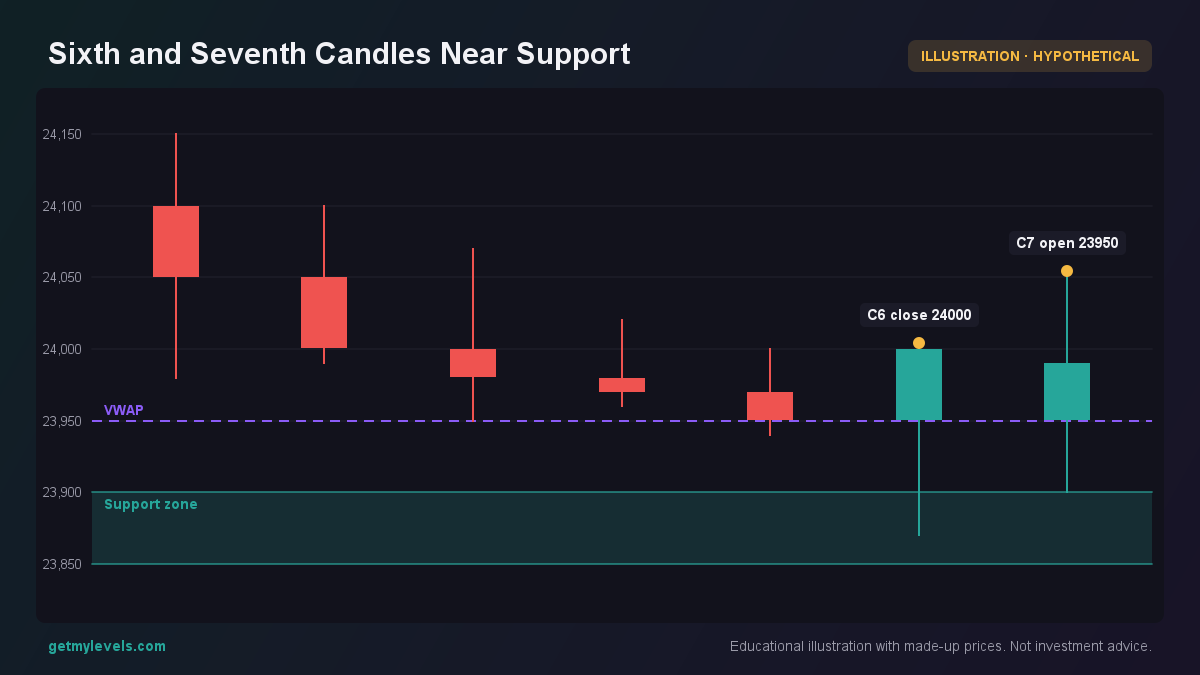 Figure 1: C6 closes at 24,000 and C7 opens at 23,950, illustrating the pause before a pullback.
To see how institutional interest might be influencing this area, look at the open-interest (OI) profile for the nearby strikes.
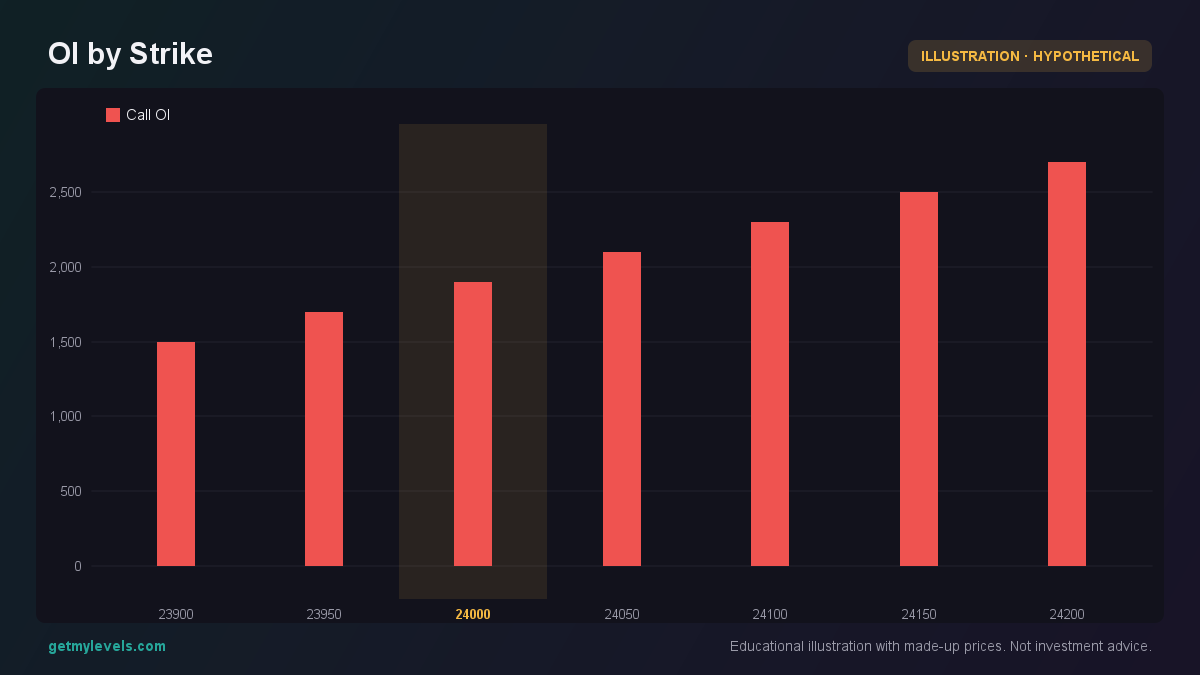 Figure 2: Call OI peaks near 24,200
The OI peaks around the 24,200 strike, indicating that many traders have positions there. When the price is near 24,000 and the OI is still high, the market may be looking for a direction.
If the order-flow imbalance (CumDelta) turns negative as the price moves below the support, that could mean selling pressure is stepping in. The VWAP line at 23,950 remains a reference point: if the price stays above it, the market might still be bullish; if it falls below, the sentiment could shift.
Common mistakes
- Treating VWAP as a fixed support or resistance – VWAP is a moving average of price and volume; it can shift quickly, especially in a fast market.
- Ignoring order-flow signals – A strong VWAP level with weak imbalance may not be as meaningful as a VWAP level that coincides with a heavy buying or selling push.
- Over-reliance on a single indicator – Use VWAP and imbalance together, but also look at broader structural levels like institutional zones, which can be seen on GetMyLevels.
How it fits with support and resistance zones
VWAP and order-flow imbalance are most useful when viewed alongside the institutional support and resistance zones that have been built from the whole price history. The zones give a broader view of where the market has historically paused or reversed.
The figure below shows a price path that breaks a support zone, illustrating how the VWAP and imbalance can help identify that shift.
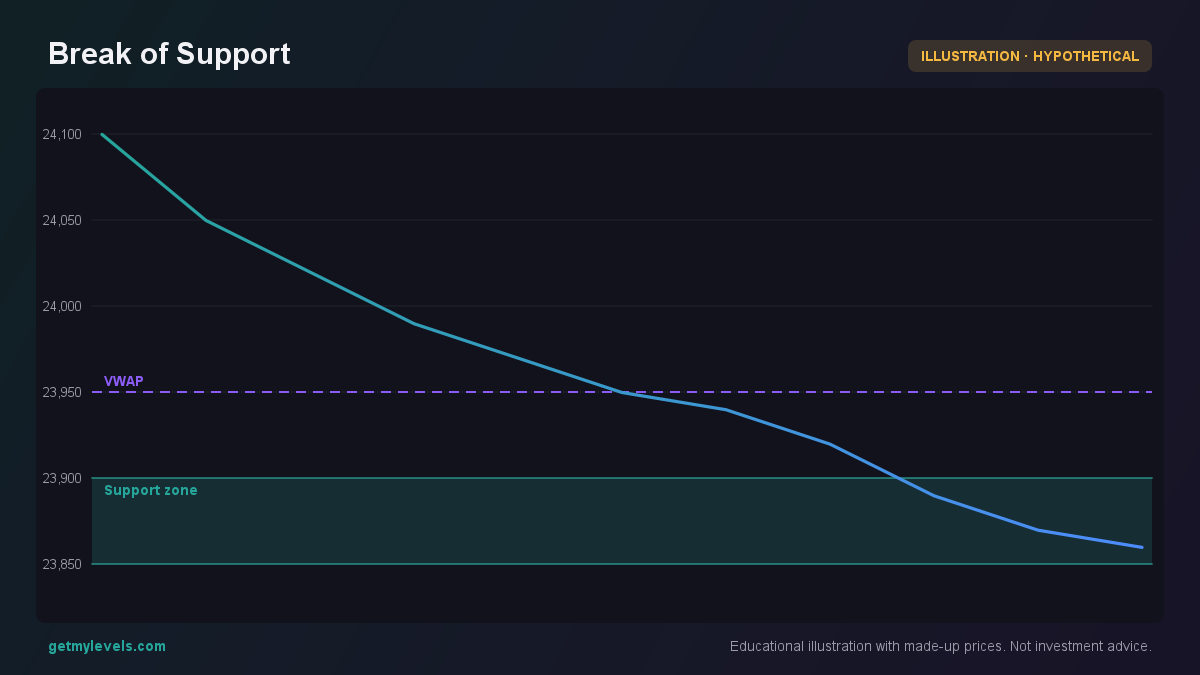 Figure 3: Price breaks support while VWAP remains a guide
When the price crosses below the support zone and stays below the VWAP, it may suggest that sellers are asserting control.
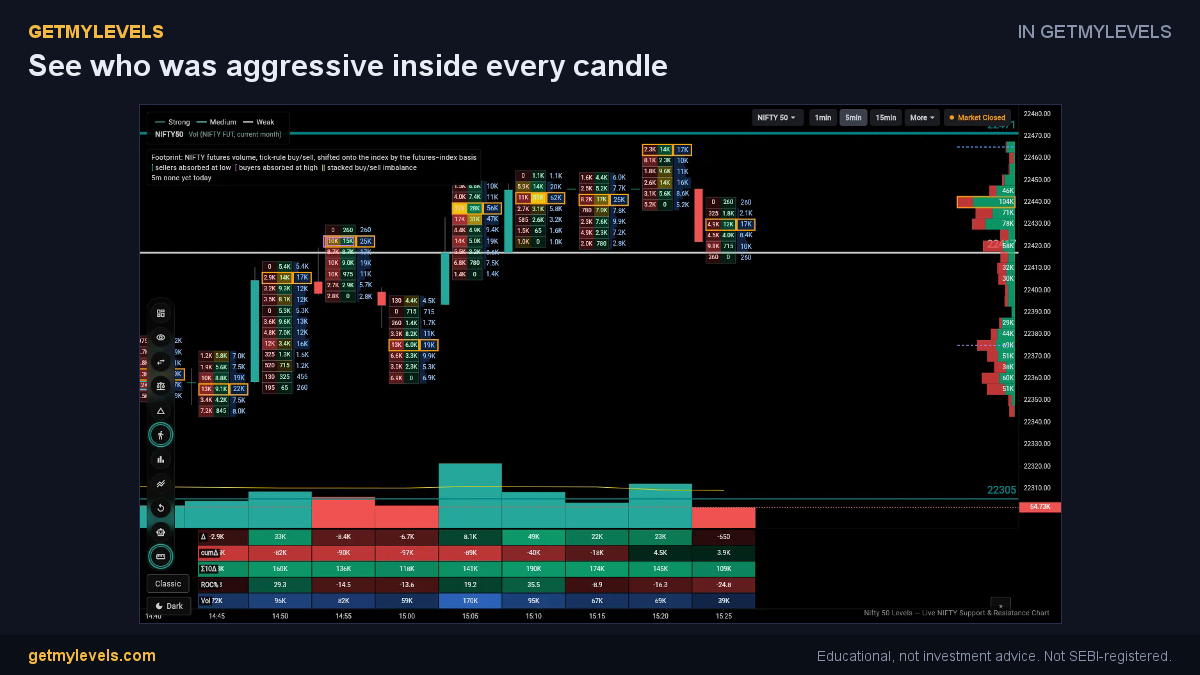 In GetMyLevels: See who was aggressive inside every candle. The live chart draws this for NIFTY, BANK NIFTY and SENSEX.
Summary
- VWAP is a useful reference for the average price weighted by volume, but it moves with the market.
- Order-flow imbalance shows real-time buying vs. selling pressure and can confirm whether a VWAP level is being contested.
- Combining a VWAP line with an imbalance signal near an institutional support or resistance zone gives a clearer picture of market intent.
- Always look at the broader structure of zones; GetMyLevels provides a live overlay of these zones for NIFTY, BANK NIFTY, and SENSEX.
- No single method removes risk; use these tools as part of a holistic view.
The next time you scan the chart, try adding VWAP and checking the order-flow imbalance around the key zones you see. It can add another layer of insight to your market assessment.
Written by an AI agent from GetMyLevels level data and checked by automated compliance rules. Educational, not investment advice. Not SEBI-registered.