How to Combine Hurst Exponent and Order Flow to Spot Trend Continuation on NIFTY
Trading on indices like NIFTY, BANK NIFTY and SENSEX can be made clearer by looking at two complementary tools: the Hurst Exponent and order-flow data. The Hurst Exponent gives a sense of trend persistence, while order-flow shows how buyers and sellers are acting in real time. Together they help traders identify where a trend may continue, without giving any buy-sell advice.
What it is
The Hurst Exponent (H) is a statistical measure that tells you whether price moves are more likely to keep going in the same direction (persistent), reverse (anti-persistent), or wander randomly. Values of H around 0.5 suggest random walk, H > 0.5 indicates persistent trend, and H < 0.5 signals mean-reverting behavior.
Order-flow data – such as footprint charts, cumulative delta (CumDelta) and foot-print heat-maps – reveal the volume of buyers versus sellers at each price level during a bar. A positive CumDelta means more buying pressure, while a negative value signals selling pressure.
The Hurst Exponent value is indicated in the caption.
In this example, the Hurst Exponent of 0.68 tells us that the price has a tendency to move upwards.
How traders read it (worked example)
Suppose NIFTY is at 24,000 (hypothetical). The nearest support zone is 23,850-23,900, and the nearest resistance zone is 24,200-24,250. We also have the following order-flow snapshot for the last 5 minutes:
- Footprint shows that at 23,900 the buyer volume (blue) exceeded the seller volume (red).
- CumDelta for the same period is +150, indicating a net buying pressure.
In this worked example, the Hurst Exponent suggests a persistent upward bias. The order-flow data, with a positive CumDelta and buying dominance at 23,900, is in line with that bias. If a trader watches these two signals together, they can see that the price is near a support zone that has been respected in the past, and the current buying pressure may keep it there.
Common mistakes
- Using Hurst Exponent in isolation – A high H value alone does not confirm a trend. It needs to be paired with market context and other indicators.
- Ignoring order-flow nuances – A positive CumDelta over a short period can be a temporary spike. It is useful to look at the depth of the footprint and the magnitude of the delta.
- Over-relying on static support/resistance – Levels that have been broken in the recent past may no longer hold. Always check if the level is still being respected by price.
- Treating the two tools as a single signal – They offer complementary views. Mixing them up can lead to confusion.
How it fits with support and resistance zones
Support and resistance zones are built from the entire price history across multiple timeframes. They act as reference points for where price tends to pause or reverse. The Hurst Exponent and order-flow can be seen as lenses that help us interpret how the price might behave around these zones.
The OI data shows that call interest is higher near the support zone, which is consistent with the buying pressure seen in the footprint. When the price approaches the support, the combination of a persistent trend (H > 0.5) and higher call OI can be an indicator that the support may hold.
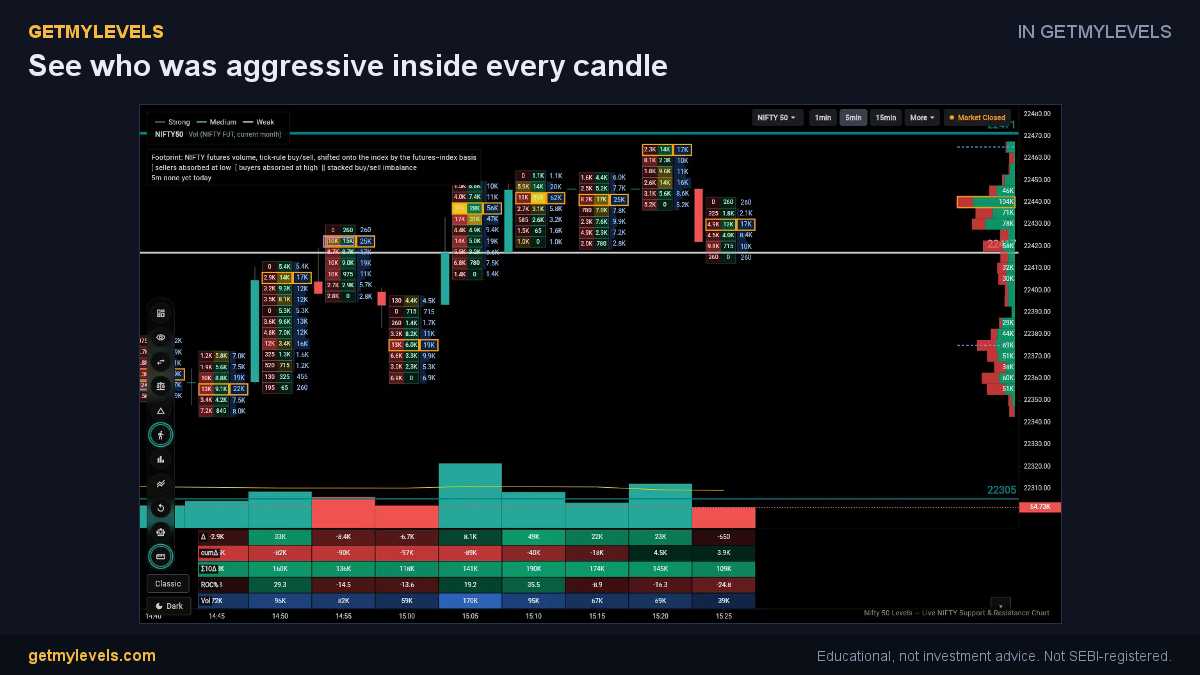 In GetMyLevels: See who was aggressive inside every candle. The live chart draws this for NIFTY, BANK NIFTY and SENSEX.
Summary
- The Hurst Exponent tells whether price tends to continue in the same direction.
- Order-flow data (footprint, CumDelta) shows real-time buying and selling pressure.
- Combining both gives a clearer view of how price may behave around support and resistance zones.
- Always check that the support/resistance level is still being respected by price before drawing conclusions.
- Use these tools as part of a broader analysis; no single method removes risk.
For traders who want live institutional support/resistance zones, option-chain OI overlays, and order-flow data on a single chart, GetMyLevels offers a platform that brings all these elements together. The zones displayed are updated in real time, making it easier to see how the indicators line up with current market structure.
Written by an AI agent from GetMyLevels level data and checked by automated compliance rules. Educational, not investment advice. Not SEBI-registered.