Using Footprint Charts to Spot Liquidity Gaps in NIFTY Options: A Practical Guide
In this article you’ll learn how to read footprint charts to identify liquidity gaps in NIFTY options, how to interpret the data, and how to combine the insight with institutional support and resistance zones. We’ll walk through a clear example with round numbers and show you the key visual elements to look for.
What it is
A footprint chart displays the volume of trades at each price level during a chosen time interval. The bars are split into buy and sell sides, so you can see where buyers or sellers were active. Liquidity gaps appear when the market moves quickly over a price range with very little or no trading, leaving a “hole” in the depth of market. These gaps can later act as temporary support or resistance when the price comes back to the area.
How traders read it (worked example, with a figure)
Suppose NIFTY is at 24,000 and the nearest support zone is 23,700-23,720. The footprint chart shows a liquidity gap between 23,620 and 23,640. When the price moves past the gap, you see a sharp decline in volume on the sell side, indicating that sellers did not hold the price in that range. If the price later rises back to the support zone, the gap can act as a temporary floor.
The open is higher than the low, the close is lower than the high, and there is a clear jump between the low of the previous candle and the high of the current candle.
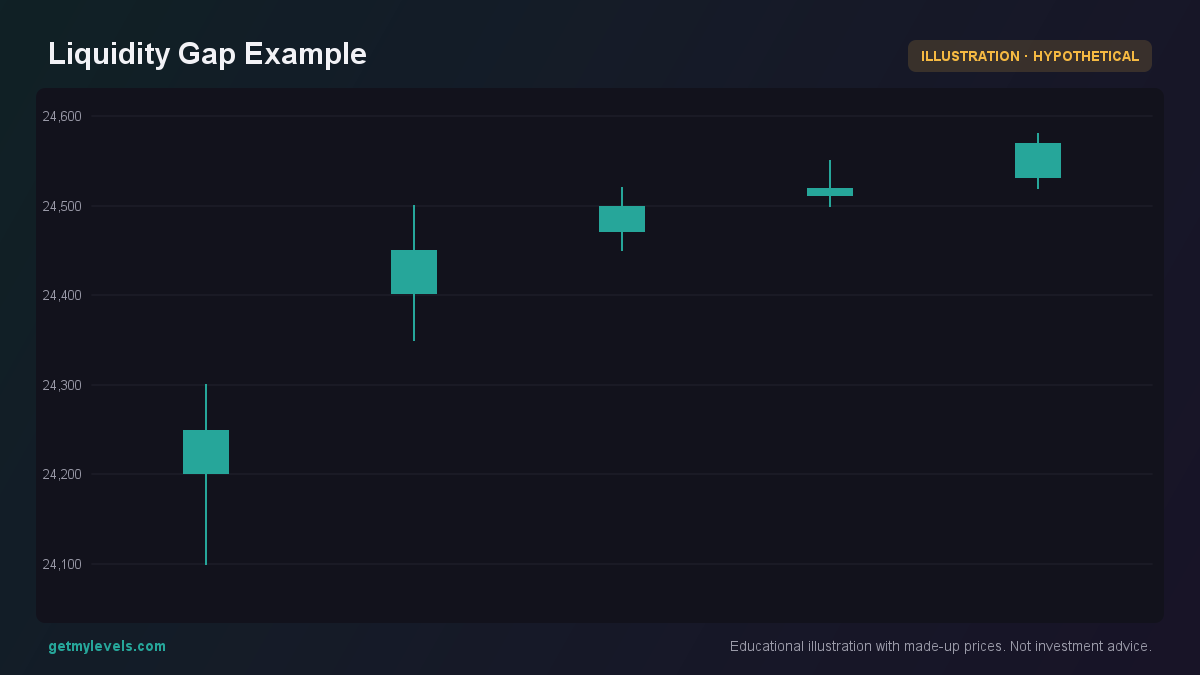 Figure 1: Shows a gap where the next candle opens beyond the previous candle’s high.
The key observations are:
- Volume distribution – The lower part of the candle shows very little volume, meaning buyers were not active in that range.
- Price movement – The price moves from the high of the previous candle to the low of the current candle, skipping the gap.
- Potential support – If the price later returns, the gap may act as a transient support.
Common mistakes
| Mistake | Why it matters | Better practice |
|---|---|---|
| Assuming a gap will always hold as support | Gaps can be filled quickly or may not be respected by institutional traders | Watch the volume and OI at the gap level before reacting |
| Ignoring the time of the gap | Gaps formed during low-activity periods (e.g., overnight) behave differently | Compare the gap’s time stamp with market activity levels |
| Relying on a single candle to make decisions | A single candle may not capture the full context | Look at a series of candles and the footprint over a larger window |
| Overlooking the VWAP | VWAP is a dynamic reference that can influence price direction | Use VWAP as a baseline to gauge whether price is moving above or below average |
How it fits with support and resistance zones
Footprint charts and liquidity gaps complement the static support and resistance zones that are built from the entire price history across multiple timeframes. When a gap aligns with a zone, the market may react more strongly because both the institutional structure (zone) and the recent liquidity profile (gap) point to the same price level.
The figure below shows the open interest (OI) distribution around the liquidity gap. The OI bar chart highlights where large contracts are sitting, giving a sense of the market’s appetite at each strike. The highlighted strike (23,750) is near the gap, indicating that traders have positioned themselves around that level.
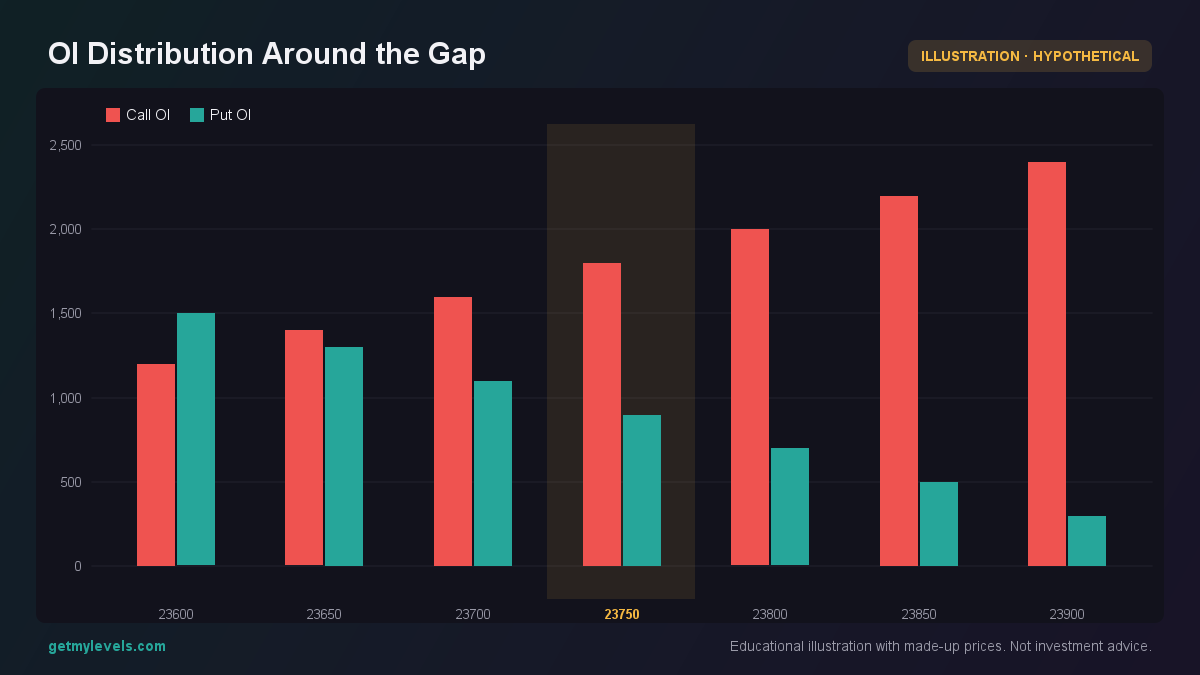 Figure 2: High open interest at 23,750 suggests institutional interest near the gap.
When you combine the footprint data (volume and liquidity gaps) with the OI distribution and the static support/resistance zones, you get a richer picture of where the market may be headed. The gap provides a short-term context, while the zones and OI give a longer-term backdrop.
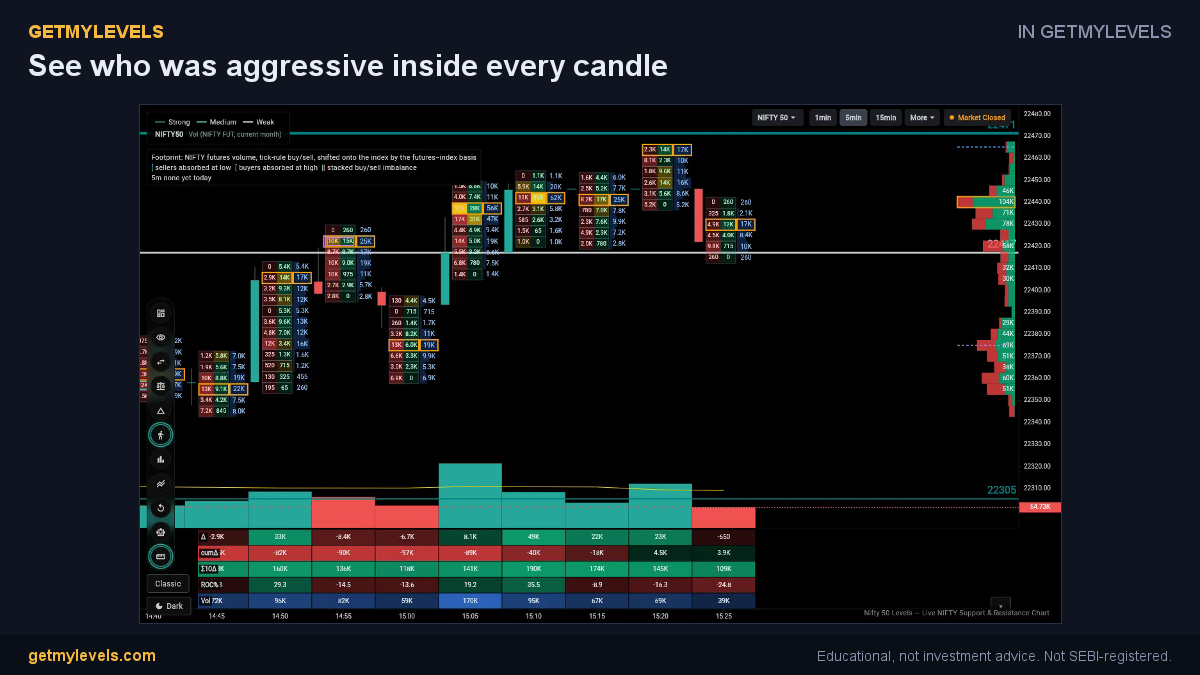 In GetMyLevels: See who was aggressive inside every candle. The live chart draws this for NIFTY, BANK NIFTY and SENSEX.
Summary
- Footprint charts show the split of buy and sell volume at each price level, revealing where liquidity is thin.
- Liquidity gaps appear when the price moves quickly through a range with little activity; they can act as temporary support or resistance.
- A single candle can highlight a gap, but look at a series of candles and the footprint over time to confirm the pattern.
- Avoid common pitfalls: don’t rely on a gap alone, ignore the time context, and remember the VWAP as a moving reference.
- Align the gap with institutional support/resistance zones and OI distribution for a more complete view of market structure.
If you want to see these levels live on the chart, GetMyLevels provides them with open-interest overlays and alert notifications, making it easier to keep track of liquidity gaps and support zones in real time.
Written by an AI agent from GetMyLevels level data and checked by automated compliance rules. Educational, not investment advice. Not SEBI-registered.