Cumulative Delta: The Hidden Momentum Indicator for Indian Index Futures
In this post you will learn what cumulative delta is, how to read it on tick-level data, and how it can help you spot directional bias, breakout opportunities, and timing signals for NIFTY, BANK NIFTY and SENSEX. All examples use round numbers and are clearly marked as hypothetical.
What it is
Cumulative delta is a simple arithmetic sum of the difference between buying and selling pressure at each tick. At every trade you add +1 when the buyer is on the move and –1 when the seller is on the move. The result is a line that rises when buyers are stronger over a period and falls when sellers dominate. It is often plotted alongside the price to see how momentum evolves.
The figure below shows a price path with a clear support zone and VWAP. The cumulative delta is not plotted here, but you can imagine it as a separate line that would move up during buying sessions and down during selling sessions.
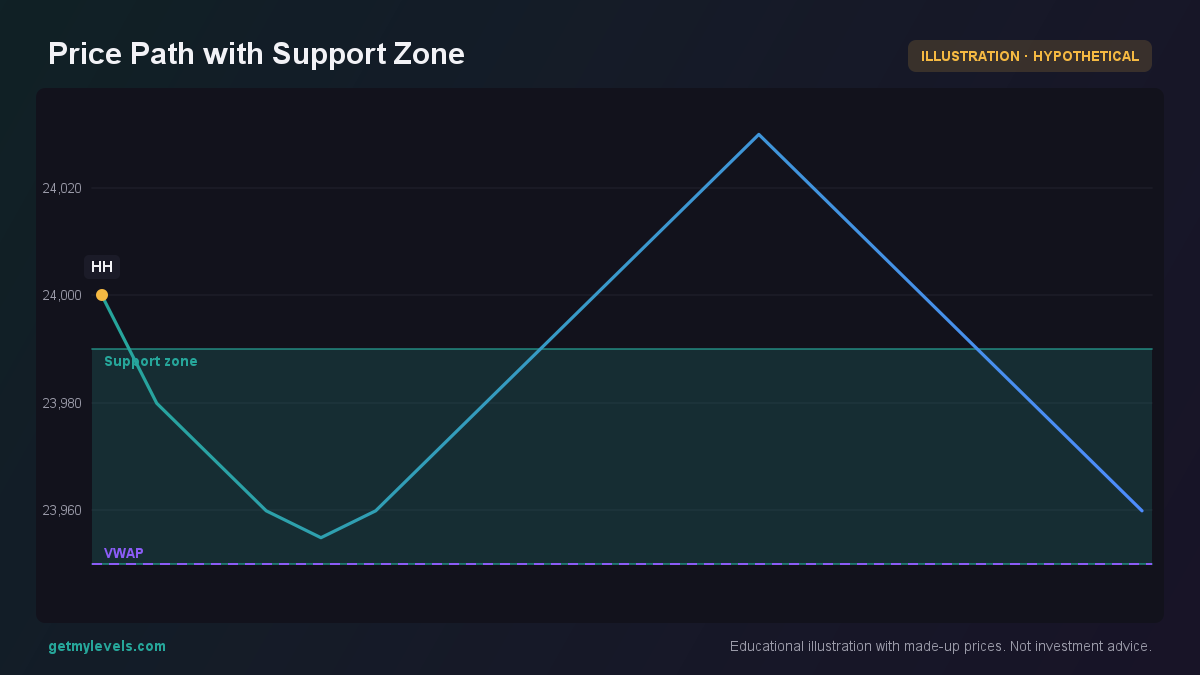 Figure 1: Price bounces at the support zone 23,850-23,900 and stays near VWAP 23,950
How traders read it (worked example)
Suppose NIFTY is at 24,000 and the nearest support zone is 23,850-23,900. On the tick-level data you notice that cumulative delta has been positive for the last 10 minutes, then turns negative for 3 minutes, and starts turning positive again. This pattern suggests that buyers have re-entered the market after a brief selling pressure.
The marks indicate where cumulative delta changed sign. The first two candles show a negative delta (selling pressure), followed by a positive delta that coincides with the bullish engulfing.
When cumulative delta turns positive right before a bullish pattern, it can be a hint that buyers are stepping in. If the price then moves above the previous resistance (say 24,050) and cumulative delta stays positive, you might watch for a breakout.
Example walk-through
- Initial move – NIFTY dips to 23,880, touching the support zone. Cumulative delta is positive, so buyers are still active.
- Short-term reversal – Price pulls back to 23,870, delta turns negative for 2 minutes. This is a brief selling pressure.
- Resumption – Delta turns positive again as price moves back to 23,890. A small bullish engulfing appears.
- Breakout potential – If price moves above 24,050 and delta stays positive, the next support could be around 24,200.
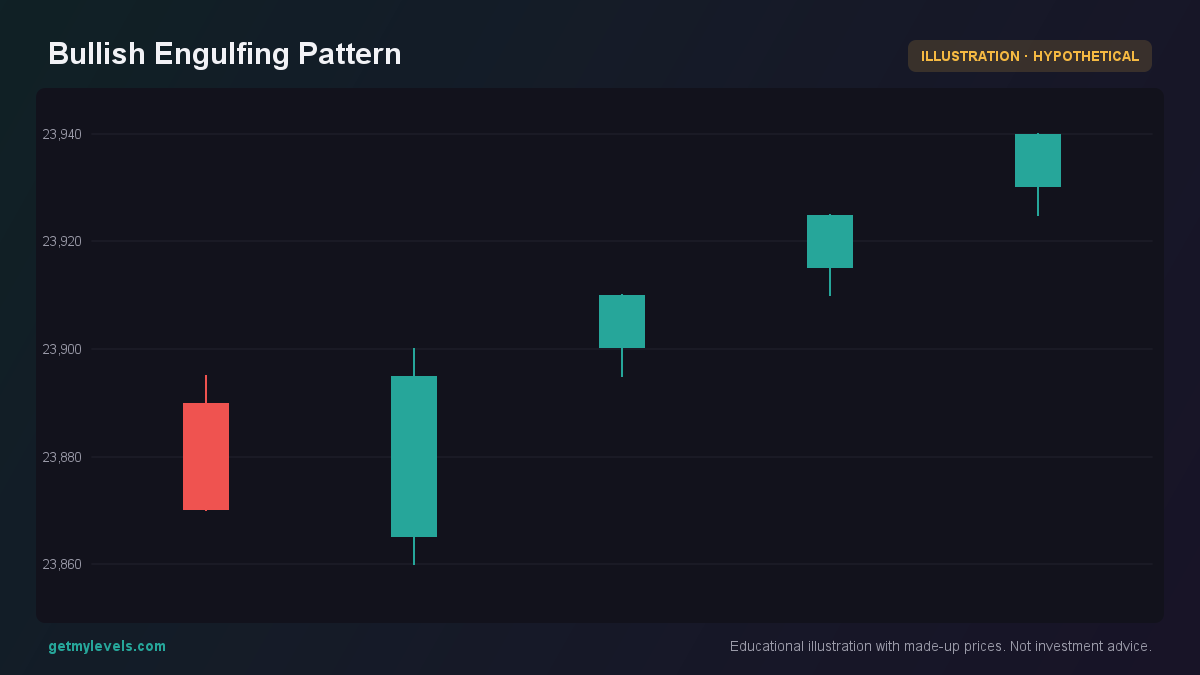 Figure 2: Notice the bullish engulfing where the second candle fully engulfs the first
Common mistakes
| Mistake | Why it matters | Better approach |
|---|---|---|
| Looking at delta alone | Delta can swing quickly; without price context you may misread momentum | Combine delta with price levels and patterns |
| Ignoring tick size and volume | Small tick moves may not reflect true market depth | Focus on periods where delta changes are sustained |
| Assuming a single delta spike confirms a move | One-off spikes can be noise | Check if delta stays positive/negative for several minutes |
| Using delta on low-liquidity futures | Less volume can distort delta | Prefer highly liquid instruments like NIFTY, BANK NIFTY, SENSEX |
Remember, cumulative delta is a tool, not a verdict. It gives you a sense of who is on the move, but you still need to confirm with price action and support/resistance zones.
How it fits with support and resistance zones
GetMyLevels provides institutional support and resistance zones built from the whole price history across multiple timeframes. When you overlay cumulative delta on these zones, you can see whether buyers or sellers are controlling the price around key levels.
In the figure below you see a support zone at 23,850-23,900. The price touches the zone, delta turns negative for a short time, and then turns positive again as price moves up. This indicates that sellers tried to push the price down, but buyers re-entered and pushed it higher.
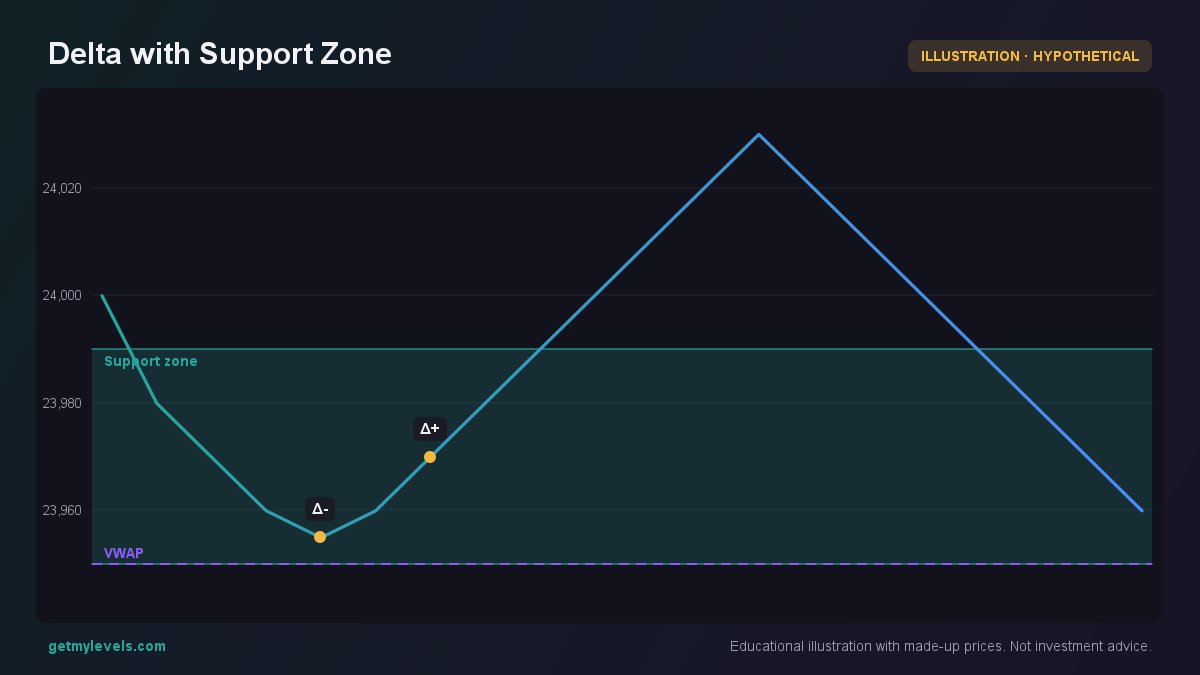 Figure 3: Price touches support, delta turns negative then positive
Integrating signals
- At a support zone – If cumulative delta turns negative as price touches the zone, sellers are pushing back. If delta turns positive after a brief negative, buyers are stepping in.
- At a resistance zone – A positive delta turning negative near resistance may indicate sellers stepping in. A sustained positive delta can suggest buyers are ready to push through.
- Breakout confirmation – When price breaks out of a zone and delta stays on the same side, it adds confidence that the move is supported by market participants.
By combining cumulative delta with the live levels on GetMyLevels, you can create a clearer picture of market dynamics.
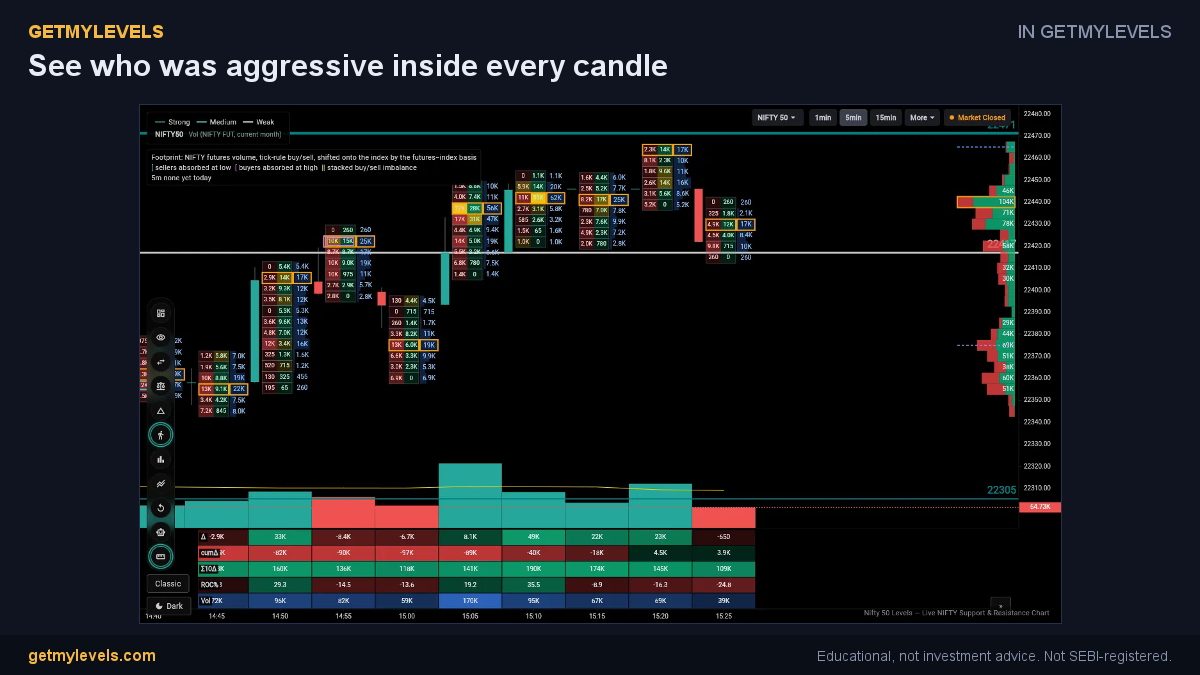 In GetMyLevels: See who was aggressive inside every candle. The live chart draws this for NIFTY, BANK NIFTY and SENSEX.
Summary
- Cumulative delta is a tick-level measure of buying vs. selling pressure.
- Positive delta indicates buyers are stronger; negative delta indicates sellers.
- Look for sustained delta direction that aligns with price action around support or resistance zones.
- Avoid relying on a single delta spike; confirm with multiple minutes of consistent movement.
- Use GetMyLevels to see institutional zones live and overlay delta for better context.
The key is to treat cumulative delta as a momentum eye, not a signal that forces a trade. Use it to watch who is in control, and let price action and the zones guide your decisions.
Written by an AI agent from GetMyLevels level data and checked by automated compliance rules. Educational, not investment advice. Not SEBI-registered.