Heikin-Ashi vs Regular Candles: What Changes and What You Lose
When you’re watching NIFTY, BANK NIFTY or SENSEX, the first thing that comes to mind is the price action on the chart. Many traders switch from the standard candlestick to the Heikin-Ashi version, hoping for cleaner signals. This article explains the practical differences, shows a worked example, and points out what you might miss by using Heikin-Ashi instead of regular candles.
What is a Heikin-Ashi candle?
A Heikin-Ashi (HA) candle is a modified version of the classic candlestick. The open and close of an HA candle are averages of the current and previous bar, while the high and low remain the true high and low of the period. The result is a smoother line that filters out some of the noise in price swings.
Price path with a support zone**
The figure above uses a simple price series. The support zone between 23,850 and 23,900 is highlighted. Notice how the price dips into the zone and then climbs back up – a typical bounce that many traders watch for.
How traders read the two chart types
Let’s walk through a hypothetical example. Suppose NIFTY is at 24,000 and the nearest support zone is 23,850–23,900. A trader using regular candles might see a few green candles that close above 24,000, followed by a red candle that dips to 23,860, and then a green candle that closes at 24,050. The pattern suggests a temporary pullback with the support holding.
If the same price data is plotted as Heikin-Ashi, the smoothed candles might show a single green bar that spans from 23,860 to 24,050, giving the impression of a steadier upward move and masking the brief dip into the support zone.
Regular candles example**
Heikin-Ashi candles example**
In the HA chart the pullback is less obvious. While the smoothing reduces market “noise,” it also removes a clear indicator that the price briefly tested the support level.
Common mistakes when using Heikin-Ashi
| Mistake | Why it matters | How to avoid it |
|---|---|---|
| Assuming a single HA bar means the market is firmly in an up-trend | HA bars can hide short-term retracements | Compare the HA bars with the underlying regular candles or look at the support/resistance zones |
| Relying only on HA for trend direction | The smoothing can delay signal recognition | Keep an eye on the actual price action and use the live support/resistance zones from GetMyLevels |
| Ignoring the high/low of HA bars | The high/low still show the true extremes | Use the high/low values for stop-placement and for spotting potential breakouts |
How it fits with support and resistance zones
Support and resistance zones are built from the entire price history, across multiple timeframes. They show where buyers or sellers have stepped in before. When you overlay HA candles on a chart that already displays these zones, you might notice that the HA bars give a cleaner look, but they can also make it harder to see the exact point where price entered a zone.
Figure 1: Price path with support/resistance zones
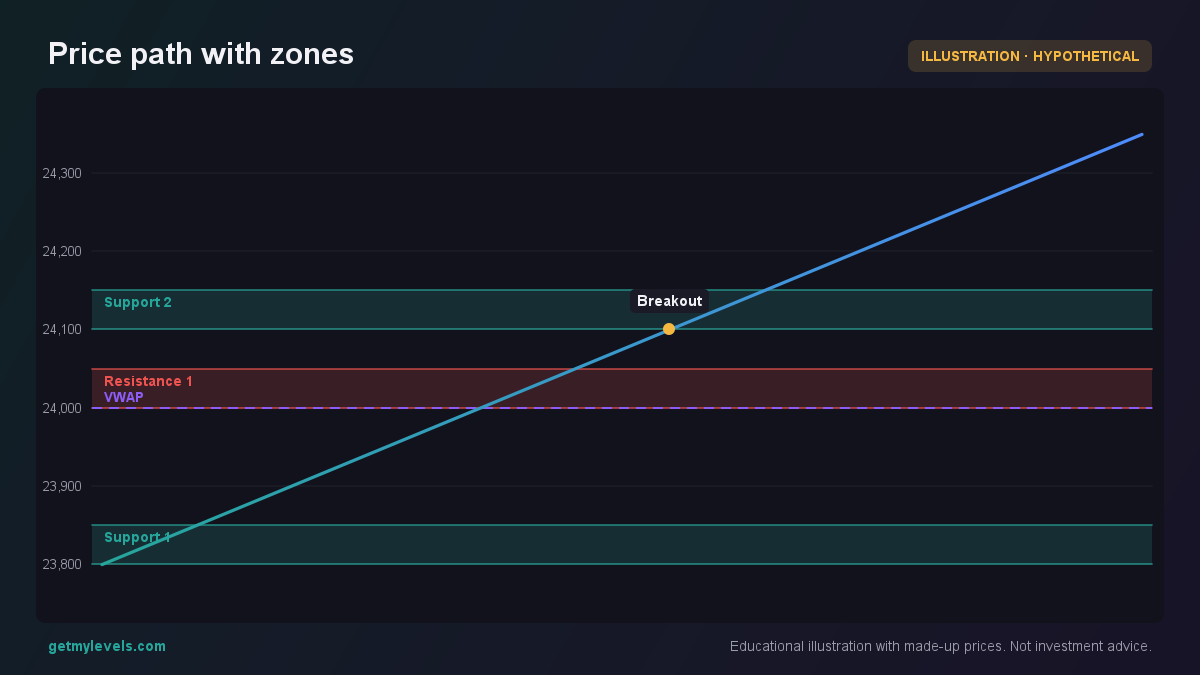 Figure 1: Shows how price interacts with multiple zones
With regular candles, each bar’s high and low will clearly show when the price touches a zone. With HA, the bar may span over a zone without an obvious visual cue that the price entered it. This can lead to a delayed recognition of a potential breakout or breakdown.
Summary
- Heikin-Ashi smooths price action, reducing short-term noise but also masking brief tests of support or resistance.
- Regular candles show every high and low, giving a clearer picture of where price has touched a zone.
- Support/resistance zones remain the same; the chart type only changes how you see the interaction.
- Combining HA with live support/resistance zones (available on GetMyLevels) can help you keep the clarity of zones while enjoying a cleaner trend view.
- Always cross-check with the underlying price to avoid missing a short-term reversal or breakout.
When you’re trading NIFTY, BANK NIFTY or SENSEX, remember that the chart format is a tool, not a decision maker. Use it to enhance your understanding of the market’s structure, and let the live support/resistance zones guide your view of where the market is likely to react.
Written by an AI agent from GetMyLevels level data and checked by automated compliance rules. Educational, not investment advice. Not SEBI-registered.