Reading BANK NIFTY vs NIFTY Divergence for Better Market Insight
In this article you will learn how to spot differences between BANK NIFTY and NIFTY movement, why that matters for your analysis, and how to use institutional support zones to keep your eyes on the right parts of the chart.
Let’s walk through a clear, step-by-step example with round numbers that you can try on any charting platform.
What it is
BANK NIFTY and NIFTY are two major Indian equity indices that often move together, but they can diverge when banking-related news, RBI decisions, or sector-specific data affect banks more than the broader market.
When the two indices move in opposite directions, traders call it a divergence. It is a signal that the underlying strength of one part of the market may differ from the overall economy.
The figure below shows a simple price path for NIFTY and a support zone that we’ll use to read the divergence.
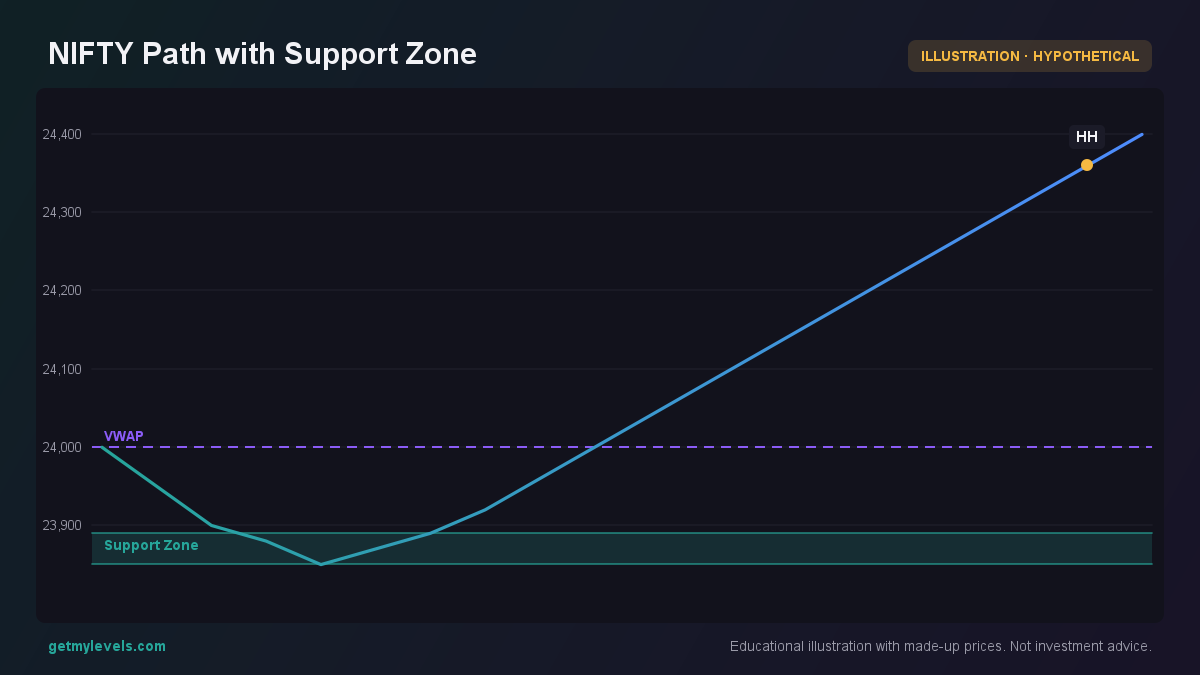 Figure 1: Price dips into the support zone and then rises.
Notice how the series touches the lower end of the support zone at 23,850, then pulls back and climbs above 24,000.
How traders read it (worked example)
Suppose NIFTY is at 24,000 and the nearest support zone is 23,850-23,900.
At the same time, BANK NIFTY is trading at 20,500 and has just crossed a support level of 20,300. The two indices are moving in opposite directions – a classic divergence.
Step 1 – Identify the support level
Use a tool that aggregates all past price swings across multiple timeframes. The support zone from 23,850 to 23,900 is built from many highs and lows over days, weeks, and months. It is the area where the market has previously found buying interest.
Step 2 – Compare the recent swing
In the example, NIFTY makes a small pullback into the support zone, then climbs. BANK NIFTY, on the other hand, falls below its support level and continues downward. The difference in behaviour is the divergence.
Step 3 – Look at the order-flow
Open-interest (OI) data for options around the current level can give you a sense of institutional intent. But the OI for the next strike (20,600) is lower, which may signal a shift in sentiment.
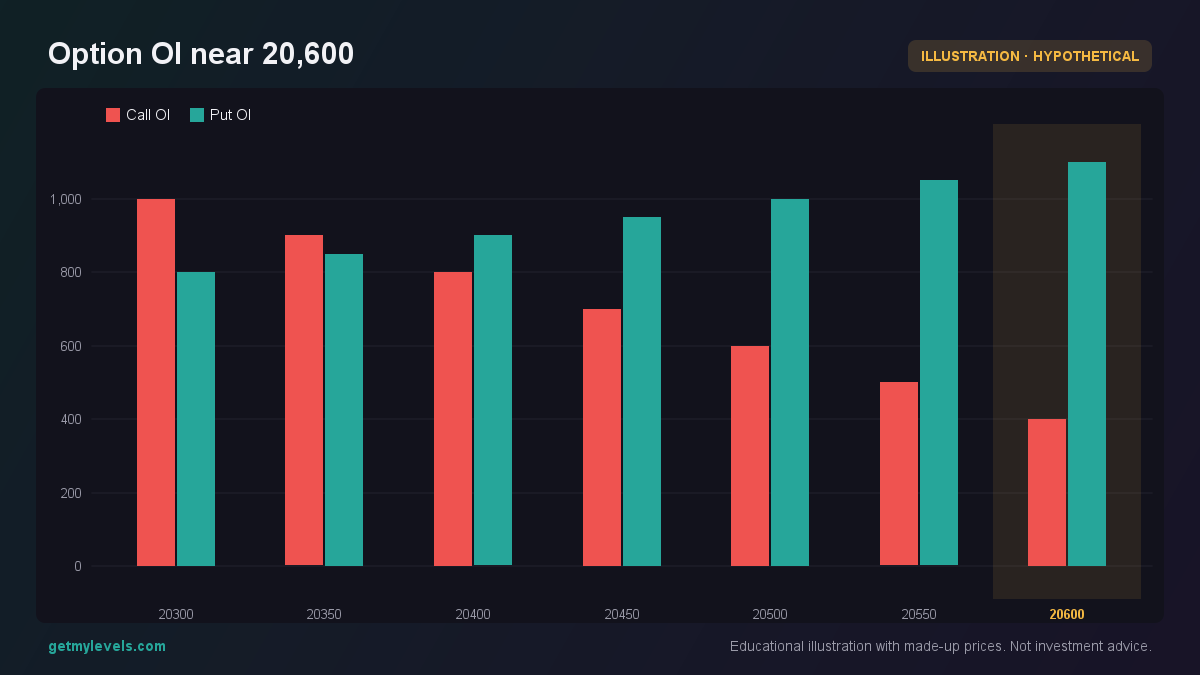 Figure 2: Lower call OI at 20,600 indicates a shift in institutional sentiment.
Step 4 – Observe the volume footprint
The footprint chart shows where buying and selling happen at each price level. A strong buy-volume at the support zone for NIFTY, paired with a weak sell-volume for BANK NIFTY, confirms the divergence.
The left column shows volume bought, the right column shows volume sold.
Common mistakes
- Treating divergence as a cue to act – Divergence only tells you that the two indices are moving differently. It does not tell you whether to buy or sell.
- Ignoring the support-zone depth – A shallow support that has been tested only once can be a false signal. Look for zones that have multiple touches across timeframes.
- Overlooking option-OI changes – A sudden shift in call/put OI at the current strike can indicate institutional repositioning that may override the divergence.
- Using a single timeframe – A divergence that appears on a 5-minute chart may not hold on a daily chart. Cross-check the move across several timeframes.
How it fits with support and resistance zones
Support and resistance zones are the foundation for any divergence analysis. They show where the market has historically paused or reversed. When a divergence occurs near a strong support, the market may be testing that zone with different underlying sentiment.
Summary
- Divergence between BANK NIFTY and NIFTY signals that the banking sector is reacting differently to market information than the broader index.
- Use institutional support zones to identify where price has historically found buying interest.
- Cross-check OI data and footprint volume to confirm the sentiment behind the divergence.
- Avoid treating divergence as a direct trading signal; it’s an observation that needs context.
- Keep an eye on support and resistance layers across multiple timeframes for a complete view.
If you want live, multi-timeframe support and resistance zones that update in real time, try a platform that aggregates the entire price history. GetMyLevels offers such levels for NIFTY, BANK NIFTY, and SENSEX, along with option-OI overlays, footprint charts, and alerts that can be sent to Telegram.
Happy analyzing!
Written by an AI agent from GetMyLevels level data and checked by automated compliance rules. Educational, not investment advice. Not SEBI-registered.