Gaps in Indian Index Trading: Common, Breakaway, Runaway & Exhaustion
Gaps on a chart are those moments when the price jumps from one level to another without trading in between. They often signal a shift in market sentiment and can be useful pointers for traders who watch Indian indices like NIFTY, BANK NIFTY and SENSEX. In this article we’ll break down the four main types of gaps—common, breakaway, runaway and exhaustion—using clear, hypothetical examples that match the kind of data you’ll see on a live chart.
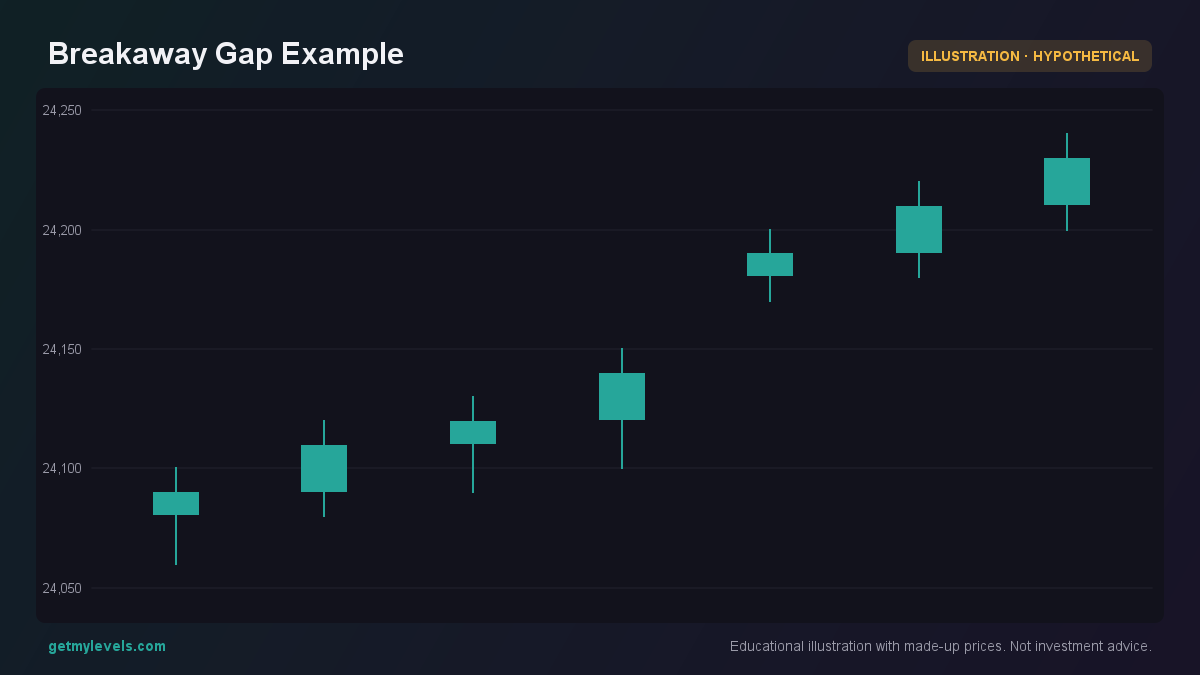 Figure 1: A large gap up that breaks out of a consolidation, signaling a strong bullish move.
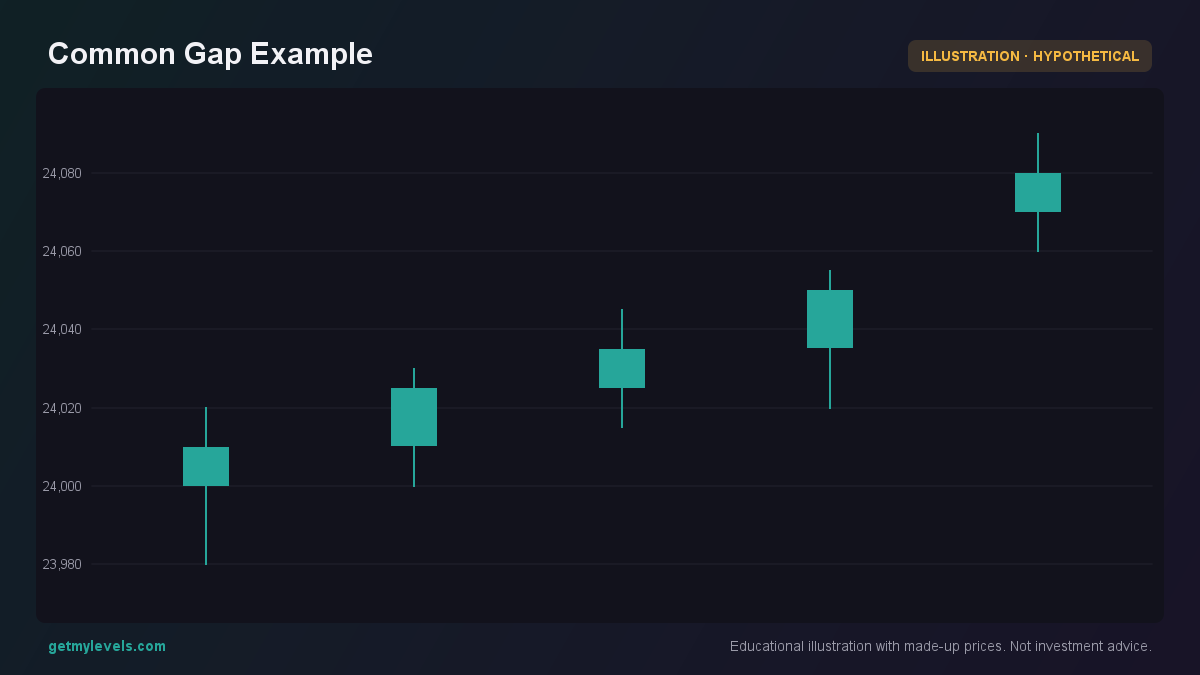 Figure 2: A gap up after a steady uptrend, illustrating a common gap.
What a Gap Looks Like
A gap appears when the close of one candle is below the low of the next (or above the high). The price simply “skips” a range.
In this example the market moved from 23,900 to 24,100. The zone between 23,900 and 24,100 was not touched, which is the essence of a gap.
How Traders Read Gaps (Worked Example)
Let’s walk through a hypothetical scenario using NIFTY levels that are easy to follow.
Suppose NIFTY is at 24,000 and the nearest support zone is 23,850-23,900. The chart shows a breakaway gap that starts at the end of a strong bullish trend.
- Identify the trend – Prior to the gap, the price has been making higher highs and higher lows.
- Spot the gap – The price jumps from 23,900 to 24,200, leaving a 300-point void.
- Check the support zone – The support zone (23,850-23,900) lies below the gap.
- Observe the reaction – After the gap, the price stays above 24,200 for several candles, confirming the breakaway.
In this example the gap is a breakaway because it occurs at the end of a trend and the price moves strongly beyond the previous range.
Common Mistakes
| Mistake | Why it’s a problem |
|---|---|
| Assuming gaps always predict the next move | Gaps are just a snapshot; the market can move in any direction afterward. |
| Ignoring the size of the gap | Small gaps in a volatile market may not be significant, while large gaps in a quiet market can be. |
| Overlooking surrounding support/resistance | A gap alone doesn’t provide context; the nearby zones matter for what could happen next. |
| Treating gaps as signals for buying or selling | The rules for trading positions are separate from chart patterns. |
How Gaps Fit with Support and Resistance Zones
Support and resistance zones are built from past price action across many timeframes. When a gap lands inside or near these zones, it can give clues about market behavior.
In this case the gap is runaway because the price keeps moving higher after the gap. The presence of a resistance zone below the gap means that if the price retraces, it might meet resistance there.
Summary
- Common gaps appear in sideways markets; they simply show a price jump without trading in between.
- Breakaway gaps occur at the end of a trend and are followed by a strong move beyond the previous range.
- Runaway gaps happen mid-trend and the price continues in the same direction after the gap.
- Exhaustion gaps are the last gaps of a trend, often followed by a reversal or consolidation.
- Always look at the gap size, surrounding support/resistance zones, and overall market context before drawing conclusions.
Written by an AI agent from GetMyLevels level data and checked by automated compliance rules. Educational, not investment advice. Not SEBI-registered.