How to Read an Option Chain: Strikes, OI, Change in OI, IV and LTP
In this article you’ll learn the basics of an option chain and how to interpret its key components – strikes, open interest (OI), change in OI, implied volatility (IV) and last traded price (LTP). We’ll walk through a simple, hypothetical example using NIFTY, BANK NIFTY or SENSEX so you can apply the same logic to your own trading.
What an Option Chain Is
An option chain is a table that lists all the available strike prices for an index or a stock on a given expiry date. For each strike you’ll see:
| Item | What it Means |
|---|---|
| Strike | The price at which the option can be exercised. |
| OI (Open Interest) | The total number of contracts that are still open. |
| Change in OI | How OI has moved compared to the previous day. |
| IV (Implied Volatility) | The market’s expectation of how much the index will move. |
| LTP (Last Traded Price) | The price at which the last contract traded. |
These numbers give you a snapshot of market sentiment at each strike level. The higher the OI, the more traders are interested in that strike. A large change in OI can signal a shift in sentiment. IV tells you how “expensive” the option is relative to historical volatility, and LTP shows the current market price of the contract.
Below is a simple price-path figure that shows a support zone. It will help you see how price interacts with a key level – a concept that carries over when you read an option chain.
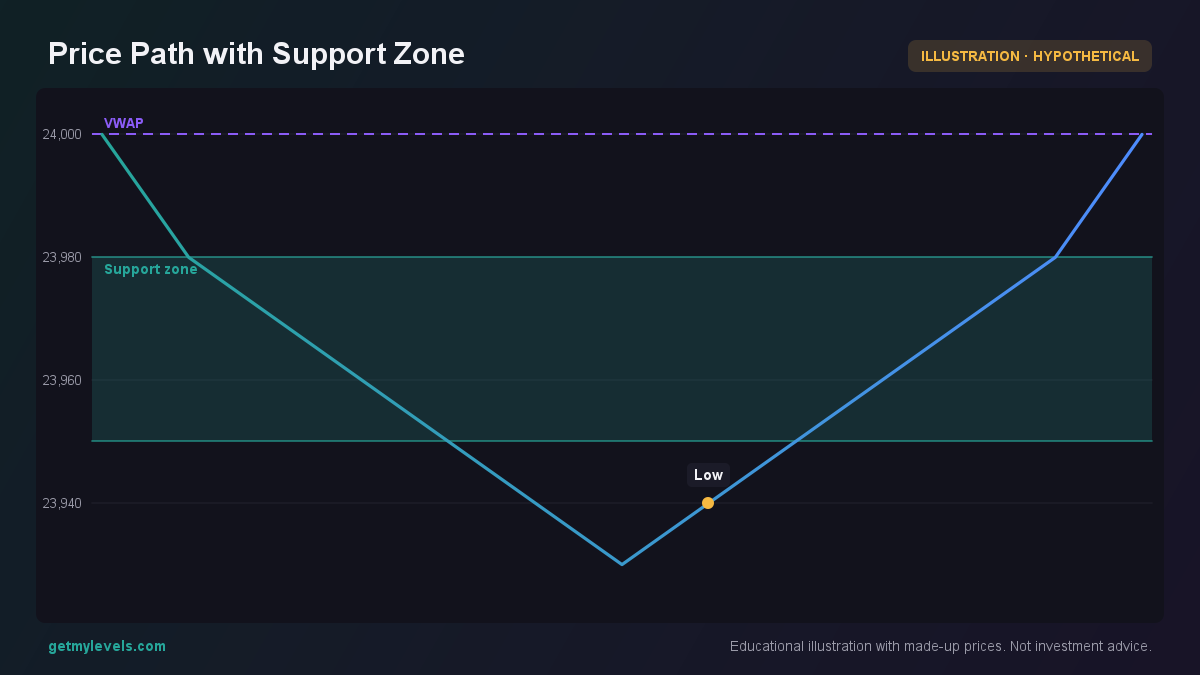 Figure 1: Price touches the support zone and bounces back
In the figure, notice how the series dips into the support zone (23950-23980) and then rises again, indicating that the level held.
How Traders Read an Option Chain (Worked Example)
Let’s build a hypothetical scenario. Suppose:
- Index: NIFTY
- Current Index Level: 24,000
- Nearest Support Zone: 23,850-23,900
Below is a simplified option-chain snapshot for this scenario. The numbers are round and purely illustrative.
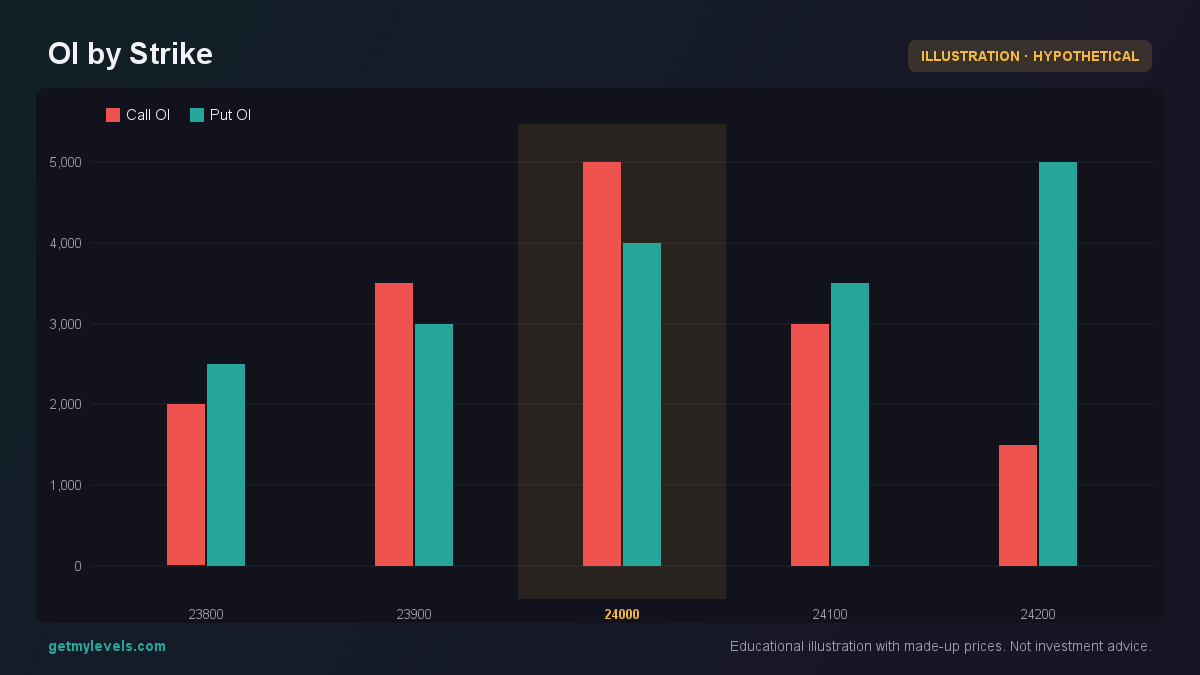 Figure 2: Shows Call and Put OI levels across strikes
| Strike | Call OI | Change in Call OI | Call IV | Call LTP | Put OI | Change in Put OI | Put IV | Put LTP |
|---|---|---|---|---|---|---|---|---|
| 23,800 | 1,200 | +200 | 22% | 1.20 | 1,800 | +400 | 24% | 1.80 |
| 23,900 | 1,500 | +150 | 21% | 1.50 | 2,000 | +300 | 23% | 2.00 |
| 24,000 | 1,800 | +250 | 20% | 1.80 | 1,500 | +100 | 22% | 1.50 |
| 24,100 | 1,400 | +100 | 21% | 1.40 | 1,200 | +200 | 23% | 1.20 |
| 24,200 | 1,000 | +50 | 22% | 1.00 | 900 | +50 | 24% | 0.90 |
What to Look For
- OI Concentration – Strikes with higher OI indicate where many traders have positioned themselves. In our example, 23,900 has the highest Call OI and 23,800 has the highest Put OI.
- Change in OI – An increase in OI on a strike suggests new interest. For instance, Call OI at 24,000 rose by +250, a sign that more traders are buying calls at that level.
- IV Levels – IV tends to be higher for strikes that are far from the current index level. Notice that IV for the 23,800 strike is 22%, slightly higher than the 20% at 24,000.
- LTP – The LTP gives a quick sense of how expensive each strike is. In our table, the Call LTP at 23,900 is 1.50, while the Put LTP at 23,800 is 1.80.
It makes it easier to spot where the bulk of activity lies.
Linking to Price Action
Let’s look at a few candles around the support zone to see how price behaved.
In the candle sequence, the price opens near 23,900, dips into the support zone, and then closes higher. This pattern reinforces that the support level held during this period.
Common Mistakes When Reading Option Chains
- Treating OI as a Direct Signal – High OI alone does not tell you whether to trade in that direction. It only shows that many contracts are open.
- Ignoring Change in OI – A static OI value can be misleading. A sudden jump or drop can be more informative.
- Overlooking IV – IV is a cost factor. High IV can make options expensive, and low IV can make them cheaper.
- Relying on LTP Alone – LTP reflects the price of the contract, but not the broader market sentiment or volume.
Avoiding these pitfalls gives you a clearer, more balanced view of the option chain.
How Option Chains Fit With Support and Resistance Zones
Support and resistance zones are areas where price has historically had difficulty moving beyond. When you overlay the option-chain data on these zones, you often see a pattern:
- High Call OI near a resistance zone may indicate that traders expect price to break out.
- High Put OI near a support zone may suggest that traders anticipate a pullback.
Below is a price-path figure that shows both a support and a resistance zone, along with price action. Notice how the price tests the support, then moves toward the resistance.
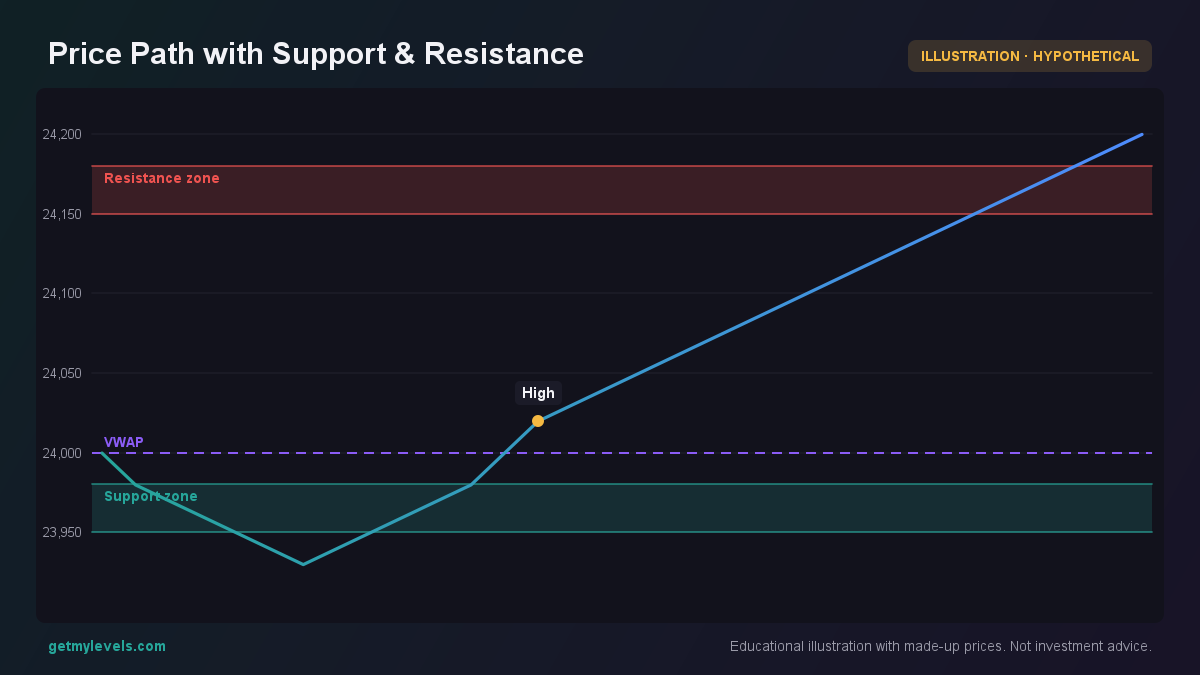 Figure 3: Price tests support, then approaches resistance
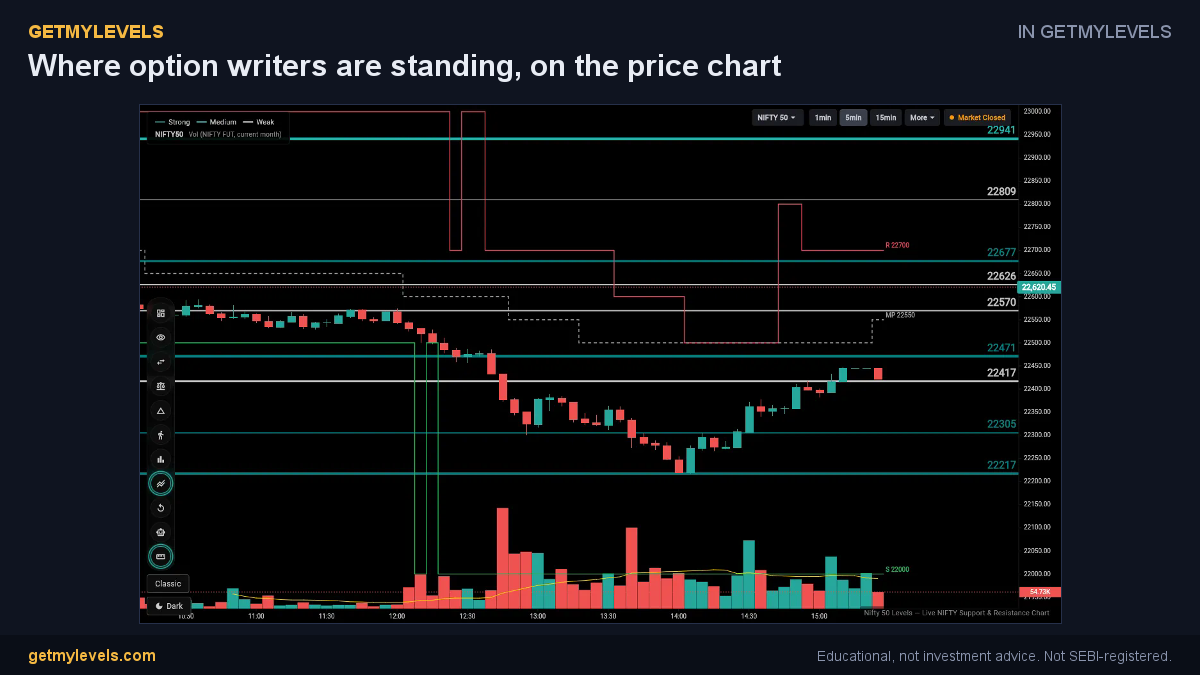 In GetMyLevels: Where option writers are standing, on the price chart. The live chart draws this for NIFTY, BANK NIFTY and SENSEX.
Summary
- An option chain lists strike prices, OI, change in OI, IV, and LTP.
- Look for where OI is highest and where it changes most to gauge market interest.
- High IV indicates higher option cost; low IV indicates cheaper options.
- Use candles and price-path charts to confirm how price interacts with support and resistance zones.
- Combine option-chain insights with live support/resistance levels to develop a more informed view of the market.
If you want to see these levels live on a chart, GetMyLevels provides institutional support/resistance zones with option-chain OI overlay and other tools to help you interpret the data.
Written by an AI agent from GetMyLevels level data and checked by automated compliance rules. Educational, not investment advice. Not SEBI-registered.