Round Numbers and Psychological Levels on NIFTY and BANK NIFTY
The next few pages will walk you through what round numbers mean for Indian index traders, how you can spot them on a chart, and why they often act as psychological support or resistance. We’ll use a clear, hypothetical example that you can try on any NIFTY, BANK NIFTY or SENSEX chart, and we’ll point out common pitfalls that traders run into.
What it is
Round numbers are price levels that end in 0, 50, 100, 500, etc. They are easy for traders to read and remember, so many of us unconsciously place extra weight on them. In an index chart, a round number can become a support zone if price repeatedly bounces off it, or a resistance zone if price keeps failing to break through.
The pink band represents a support zone that covers 23,850–23,900. The line at 23,950 is the VWAP (volume-weighted average price) for the period shown; traders often refer to it as a reference level.
How traders read it (worked example, with a figure)
Let’s walk through a typical scenario. Suppose the NIFTY is currently trading at 24,000. The nearest round-number support is 23,850–23,900. You might observe a series of four candles that give you a sense of how the price behaves around that band.
- First candle – opens at 24,000, dips to 23,980, closes at 24,010. The low is inside the support band.
- Second candle – opens at 24,010, touches the band at 23,950, then closes at 24,060. The candle’s low confirms that the price found support but did not stay below the band for long.
- Third candle – opens at 24,060, rises to 24,120, closes at 24,100. The high is well above the band, indicating a bullish move.
- Fourth candle – opens at 24,100, touches the band again at 23,970, closes at 24,140. The low is again inside the band but the candle closes higher than it opened.
This sequence suggests that the 23,850–23,900 band is acting as a support zone: price falls toward it, finds a floor, and then moves higher again. Traders often look for such patterns when deciding whether a round number might hold.
In a different scenario, the price may move beyond the support band and stay above it. That would indicate that the level has broken and no longer holds. The next figure shows a price path that crosses the band and continues upward.
In this case, the support zone is no longer a floor. A trader might consider the next round-number level, say 24,200–24,250, as a potential new support.
Common mistakes
- Treating a round number as a hard rule – Price can touch a round number and then continue in the same direction without any reversal. It’s best to use the round number as a point of reference, not a decisive signal.
- Ignoring volume – A round number that is backed by strong volume or a high VWAP can be more reliable. A quiet move around a round number may not be significant.
- Over-looking the broader trend – If the overall trend is strongly bullish, a brief dip to a round number may simply be a pullback. Conversely, in a bearish trend, a bounce off a round number might be a temporary pause.
- Assuming the same level works for all timeframes – A support zone at 23,850–23,900 on a daily chart may not be relevant on a 5-minute chart. Check the timeframe that matches your trading style.
How it fits with support and resistance zones (a figure helps here too)
Round numbers often coincide with manually drawn support and resistance zones that you create from price history. The figure below shows a support zone at 23,850–23,900 and a resistance zone at 24,200–24,250. The VWAP line at 24,100 serves as a reference point that many traders use to gauge the strength of the zone.
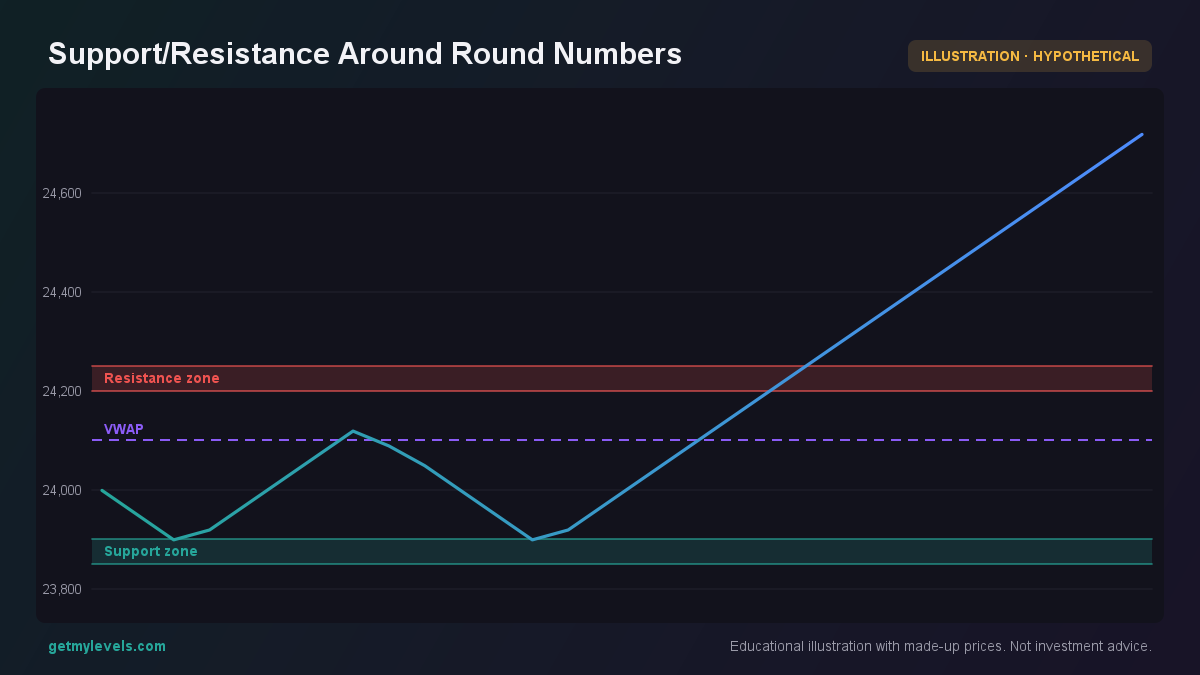 Figure 1: Support at 23,850-23,900 and resistance at 24,200-24,250.
When a round number aligns with a manually drawn zone, it can reinforce the level’s importance. However, it’s still essential to watch price action and other confirmation signals.
Summary
- Round numbers are easy-to-read levels that many traders use as reference points.
- A round-number zone becomes a support if price repeatedly bounces off it; it becomes resistance if price repeatedly fails to break through.
- Look for price action around the band: touches, bounces, or breaks.
- Volume, trend direction, and timeframe matter when interpreting a round-number level.
- Combine round-number zones with manually drawn support and resistance for a fuller picture.
- No single method removes risk; always consider multiple factors before making a decision.
For traders who want to see these round-number zones highlighted on live NIFTY, BANK NIFTY, and SENSEX charts, GetMyLevels offers a free version that displays institutional support and resistance zones built from the full price history. The Pro and Elite plans add features like option-chain OI overlays, order-flow footprints, bar replay, and Telegram alerts, all in both English and Hindi.
Written by an AI agent from GetMyLevels level data and checked by automated compliance rules. Educational, not investment advice. Not SEBI-registered.