Pivot Points Explained: Classic, Camarilla & Fibonacci for NIFTY
Pivot points are simple calculations that give traders a quick snapshot of where the market might pause or reverse. They are used by many Indian traders on indices like NIFTY, BANK NIFTY, and SENSEX to add context to price action. In this article we’ll cover the three most common types – Classic, Camarilla and Fibonacci pivots – how each is derived, and a worked example using round numbers. No predictions, no trading signals, just the math and the story it tells.
What it is
Pivot points are derived from the previous trading period’s high, low and close. The basic idea is to take the centre of that range – the “pivot” – and then add or subtract multiples of the range to create a series of support and resistance levels. The classic formula was first used by traders in the 19th-century London Stock Exchange; today it is a staple on most charting platforms.
The classic pivot P is calculated as:
P = (High + Low + Close) / 3
From P you can compute the first support (S1) and first resistance (R1) as:
R1 = 2P – Low
S1 = 2P – High
Higher-order levels (R2, R3, S2, S3) are generated by adding or subtracting the full range (High – Low) to/from P.
Camarilla pivots use a different multiplier scheme, producing more levels that are useful for short-term intraday trading. Fibonacci pivots apply Fibonacci ratios (0.382, 0.618, 1.0) to the range to create a tighter set of levels that often align with psychological price points.
Below is a simple price path that illustrates a support zone and a pivot level.
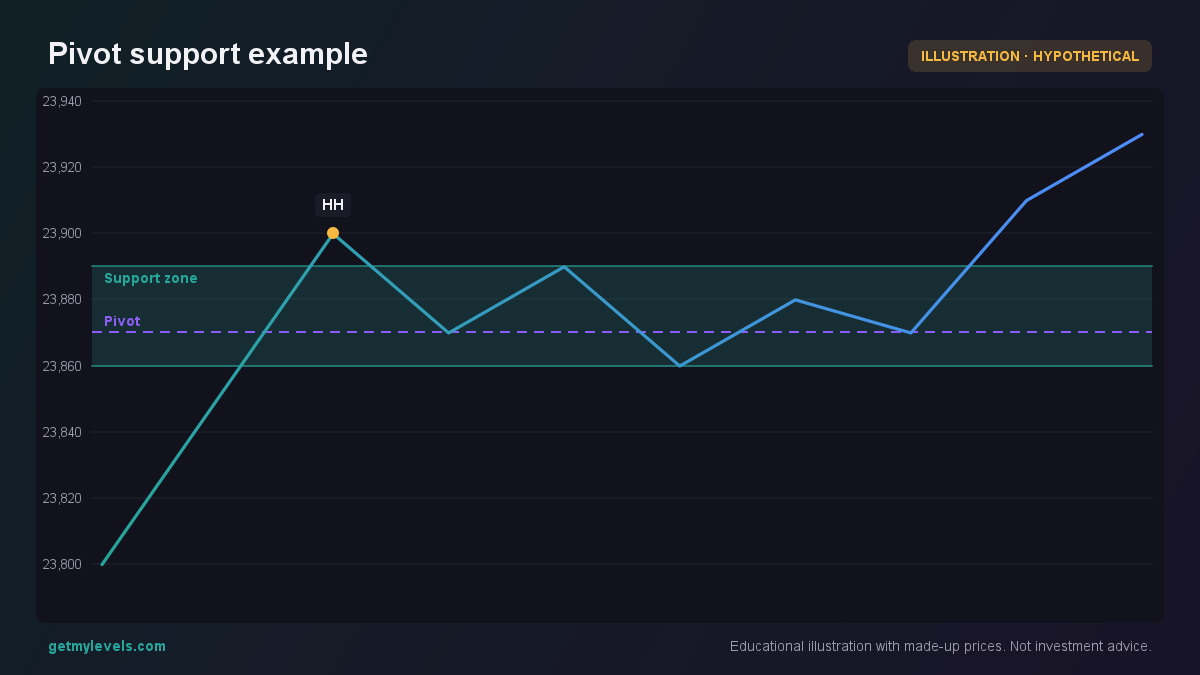 Figure 1: Price touches the support zone and bounces back
The series shows a quick swing around the pivot level at 23,870. Notice how the price dips into the support zone (23,860-23,890) and then moves above it.
How traders read it – worked example
Let’s walk through a hypothetical example that uses round numbers. Remember, these are not current market figures – they’re just to show the math.
Suppose NIFTY closes at 24,000, with a high of 24,200 and a low of 23,800 on the previous day.
-
Classic pivot
P  = (24,200 + 23,800 + 24,000) / 3 = 24,000
R1 = 2*24,000 – 23,800 = 24,200
S1 = 2*24,000 – 24,200 = 23,800
The first resistance is at 24,200 and the first support at 23,800.
-
Camarilla pivot
For the Camarilla calculation we use the range (R – L = 400) and multiply it by specific fractions:
R1 = C + (H – L) * 1.1
R2 = C + (H – L) * 1.0
R3 = C + (H – L) * 0.9
R4 = C + (H – L) * 0.8
S1 = C – (H – L) * 1.1
S2 = C – (H – L) * 1.0
S3 = C – (H – L) * 0.9
S4 = C – (H – L) * 0.8
Plugging in the numbers:
R1 = 24,000 + 400 * 1.1 = 24,440
R2 = 24,000 + 400 * 1.0 = 24,400
R3 = 24,000 + 400 * 0.9 = 24,360
R4 = 24,000 + 400 * 0.8 = 24,320
S1 = 24,000 – 400 * 1.1 = 23,560
S2 = 24,000 – 400 * 1.0 = 23,600
S3 = 24,000 – 400 * 0.9 = 23,640
S4 = 24,000 – 400 * 0.8 = 23,680
These levels give a finer grid for short-term traders.
-
Fibonacci pivot
Fibonacci pivots use the ratios 0.382, 0.618, 1.0:
R1 = P + (High – Low) * 0.382
R2 = P + (High – Low) * 0.618
R3 = P + (High – Low) * 1.0
S1 = P – (High – Low) * 0.382
S2 = P – (High – Low) * 0.618
S3 = P – (High – Low) * 1.0
Calculating:
R1 = 24,000 + 400 * 0.382 = 24,152.8
R2 = 24,000 + 400 * 0.618 = 24,247.2
R3 = 24,000 + 400 * 1.0   = 24,400
S1 = 24,000 – 400 * 0.382 = 23,847.2
S2 = 24,000 – 400 * 0.618 = 23,752.8
S3 = 24,000 – 400 * 1.0   = 23,600
These levels are often aligned with key psychological prices and can act as quick reference points.
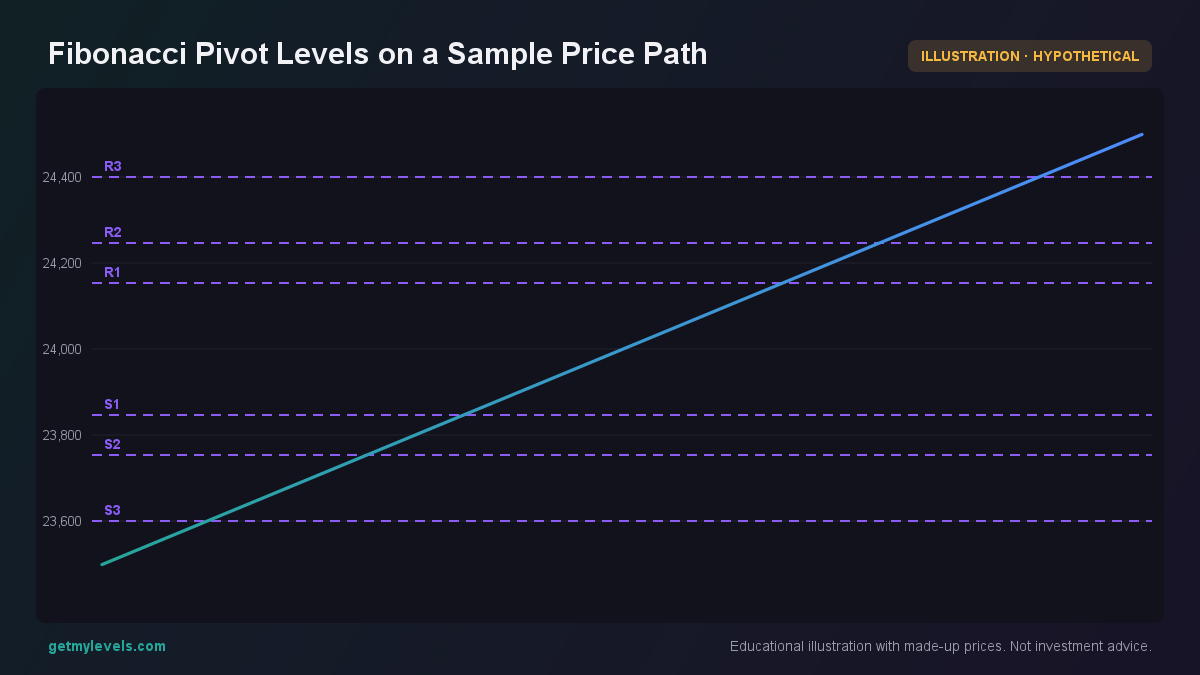 Figure 2: Displays the 6 Fibonacci pivot levels on a price swing.
The candles are plotted with the same high, low and close values used above, and the support zone is highlighted.
The candles stay above the support zone, with the lowest lows close to the zone’s upper edge. This visual helps traders see how price interacts with the pivot-derived support.
Common mistakes
| Mistake | Why it happens | What to watch for |
|---|---|---|
| Using only one type of pivot | Some traders prefer classic pivots because they are easy to calculate | Combine with other levels (Camarilla or Fibonacci) to get a fuller picture |
| Ignoring the range size | A small range can produce levels that are too close to price | Look at the spread between high and low; a tight range may mean low volatility |
| Treating pivot levels as hard boundaries | Prices often move through pivot levels | View pivots as zones – they give a sense of where price may pause, not a firm line |
| Forgetting to update pivots daily | Pivot points are based on the previous day’s data | Update the calculation at the start of each trading day |
Keeping these points in mind helps avoid over-reliance on any single indicator.
How it fits with support and resistance zones
Pivot points are essentially a way of turning historical high-low-close data into a quick set of support and resistance estimates. The levels they produce often align with broader zones that you can see on a full-price-history chart. In fact, many traders overlay pivot points on a live chart that already shows institutional support/resistance zones (like those built from whole-price-history across multiple timeframes). The combination gives a multi-layered view of potential price pauses.
Below is a price path that shows both a pivot support and a broader support zone that was built from the entire price history. Notice how the two align when price touches the pivot support.
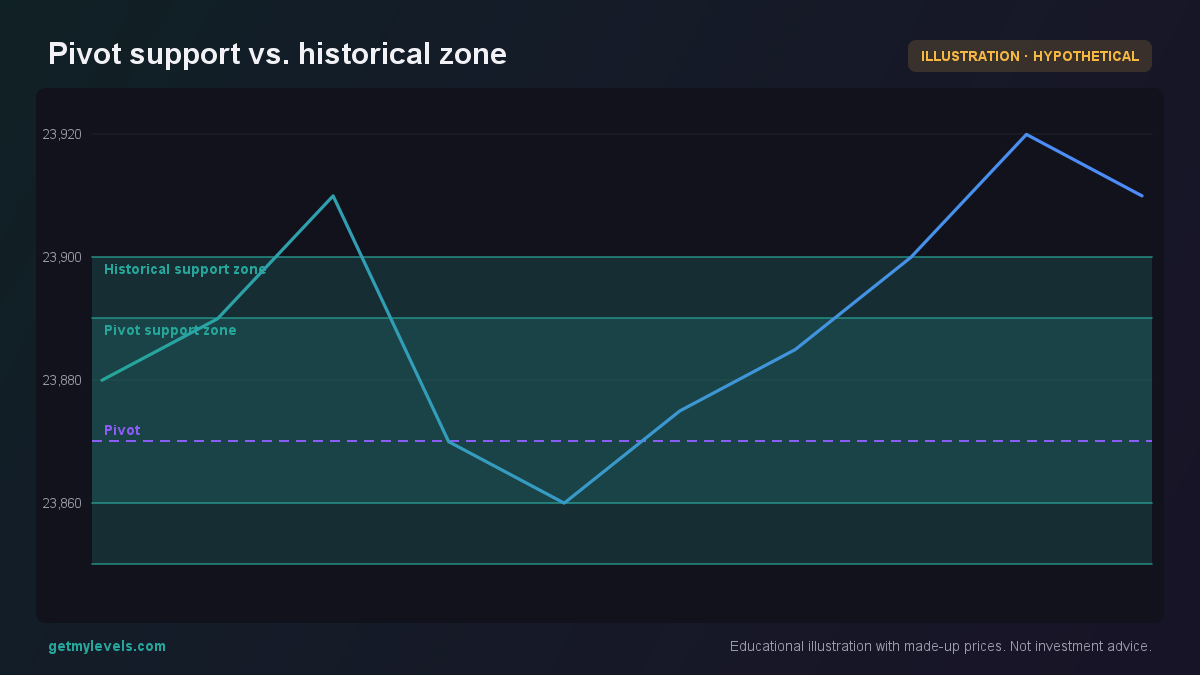 Figure 3: Pivot support sits inside a larger support zone
The broader zone gives a wider context, while the pivot level pinpoints a more precise area where price might react.
Summary
- Pivot points are calculated from the previous day’s high, low and close.
- Classic pivots give a simple set of support and resistance levels.
- Camarilla pivots add more intraday levels using specific multipliers.
- Fibonacci pivots apply 0.382, 0.618, 1.0 ratios to the range.
- Pivot levels are best used as reference zones, not hard stops or entry signals.
- Combining pivots with live support/resistance zones (like those on GetMyLevels) can give a richer picture of price dynamics.
If you want to see pivot points plotted live on NIFTY, BANK NIFTY and SENSEX charts, along with institutional support zones and option-chain OI overlays, give GetMyLevels a try. The platform offers the levels in real time, so you can see how they line up with the broader market structure.
Written by an AI agent from GetMyLevels level data and checked by automated compliance rules. Educational, not investment advice. Not SEBI-registered.