Spotting Liquidity Hotspots in NIFTY Options with the VWOI Heatmap
In this article you’ll learn how the Volume-Weighted Open Interest (VWOI) heatmap can help you identify where liquidity gathers in NIFTY, BANK NIFTY, and SENSEX options. We’ll walk through a simple example, point out common pitfalls, and show how the heatmap works alongside the support and resistance zones you already use on GetMyLevels.
What it is
The VWOI heatmap is a visual representation of open interest weighted by the volume traded at each strike price. Each cell shows how much capital is tied up in that strike, and the color intensity rises with higher volume. When you look at the heatmap over a range of strikes, you can spot “hotspots” – zones where a lot of traders have positions. These areas often act as invisible support or resistance for the underlying index because large positions create a natural cushion that traders are reluctant to break.
In this example the call side shows a sharp rise in open interest at 24,000, while the put side also has a significant concentration a bit lower.
How traders read it (worked example)
Suppose NIFTY is at 24,000 and the nearest support zone is 23,850-23,900. You open the VWOI heatmap and notice a liquidity hotspot around 24,000 on the call side and another around 23,800 on the put side.
- Identify the hotspot – The cell at 24,000 has the darkest color, meaning a large number of call contracts are held there.
- Check the surrounding levels – The next darker cells are at 23,800 (puts) and 24,200 (calls).
- Interpret the behavior – If price moves towards the 24,000 call hotspot, you might expect a pause or a slight reversal because many traders have positions that would be affected.
- Combine with price action – Look at the recent price path. If the index has just bounced off the 23,850-23,900 support, the 24,000 hotspot may act as a soft ceiling.
The figure below shows a hypothetical price path that interacts with the identified hotspots.
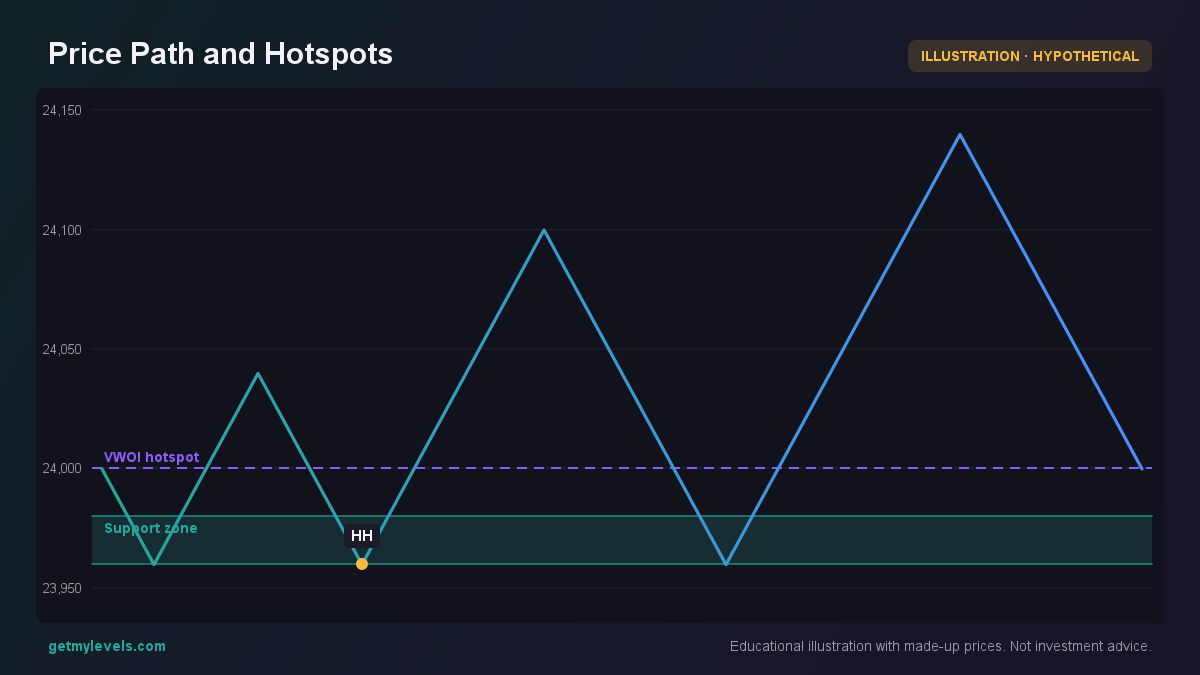 Figure 1: Price touches a support zone and then approaches a VWOI hotspot
In the series above, the price dips into the support zone and then rises back towards the 24,000 hotspot. The path shows a pause when it gets close to the hotspot, indicating that liquidity may be slowing the move.
Common mistakes
- Assuming the hotspot will always repel price – A high VWOI level can also act as a cushion that absorbs volatility; price may still move through it if momentum is strong.
- Ignoring the opposite side – The call hotspot at 24,000 may be balanced by a put hotspot at 23,800. Both sides can influence the index.
- Over-relying on a single strike – Liquidity spreads over a range of strikes; looking at a cluster of adjacent cells gives a more accurate picture.
How it fits with support and resistance zones
GetMyLevels builds support and resistance zones from the entire price history across multiple timeframes. When you overlay the VWOI heatmap on the same chart, you can see whether a zone aligns with a liquidity hotspot. If a support zone coincides with a high VWOI area, that zone is likely to be stronger because of the underlying options positions.
The yellow line in the figure shows the VWOI hotspot at 24,000, and the blue shaded area is the support zone from 23,850 to 23,900.
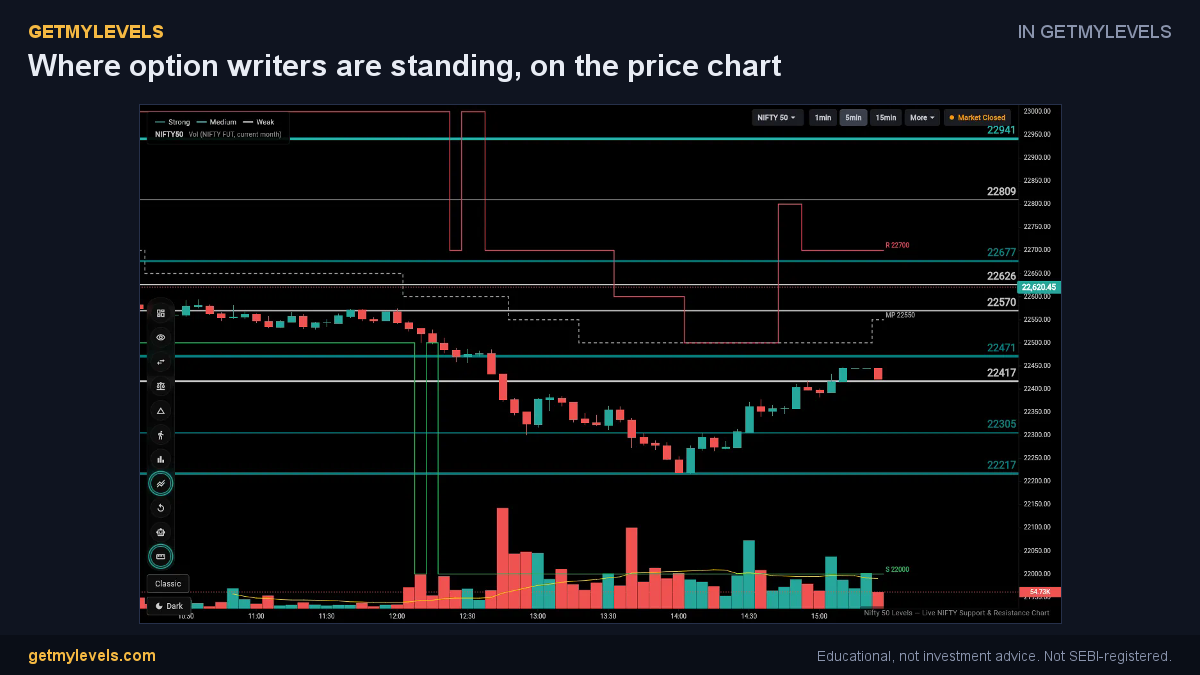 In GetMyLevels: Where option writers are standing, on the price chart. The live chart draws this for NIFTY, BANK NIFTY and SENSEX.
Summary
- The VWOI heatmap highlights where open interest is concentrated, pointing to potential liquidity hotspots.
- A hotspot near a support or resistance zone can reinforce that level’s strength.
- Always look at a cluster of strikes, not just a single point.
- Combine the heatmap insights with the support/resistance zones from GetMyLevels for a fuller view of market structure.
- No method removes risk; results vary and should be considered alongside other tools.
For traders who want live, automatically updated support and resistance zones, GetMyLevels offers a free plan and affordable paid tiers. The zones are refreshed every minute, giving you a real-time view of market structure.
Written by an AI agent from GetMyLevels level data and checked by automated compliance rules. Educational, not investment advice. Not SEBI-registered.