Using Open-Interest Delta to Read Market Sentiment in NIFTY Options
In this article you will learn how to read the Open-Interest Delta (OI-Delta) in NIFTY options and use it as an additional lens to gauge short-term market sentiment. We’ll walk through a simple, hypothetical example, show you how OI-Delta interacts with the support and resistance zones you see on the live chart, and point out common pitfalls. By the end you should feel comfortable adding OI-Delta to your routine without over-relying on it.
What it is
Open-Interest Delta is the difference between the total open interest (OI) in call options and the total OI in put options for a given expiry. If the call OI is higher, the delta is positive; if the put OI is higher, the delta is negative. A rising positive delta suggests that more traders are holding calls (or selling puts), while a falling negative delta indicates a shift towards puts (or selling calls).
In practice, OI-Delta gives a snapshot of how the market’s “big-player” exposure is moving. It is a bar-style indicator that you can read alongside price, volume, and other order-flow data.
How traders read it (worked example)
Suppose the NIFTY index is trading at 24,000 and the nearest support zone is 23,850-23,900. You are looking at the weekly option chain for the next expiry. The OI-Delta bar for the 24,000 strike shows a +200 value (call OI 3,000, put OI 2,800). This suggests a mild bullish tilt among option holders.
Now look at the daily price path for the last week. The series dips into the support zone, bounces off it, and then climbs back towards 24,000. The price series also shows a minor dip around 23,870 before rising again.
The figure below displays that price path, the support zone, and the VWAP line. The VWAP is a helpful reference for confirming the strength of the bounce.
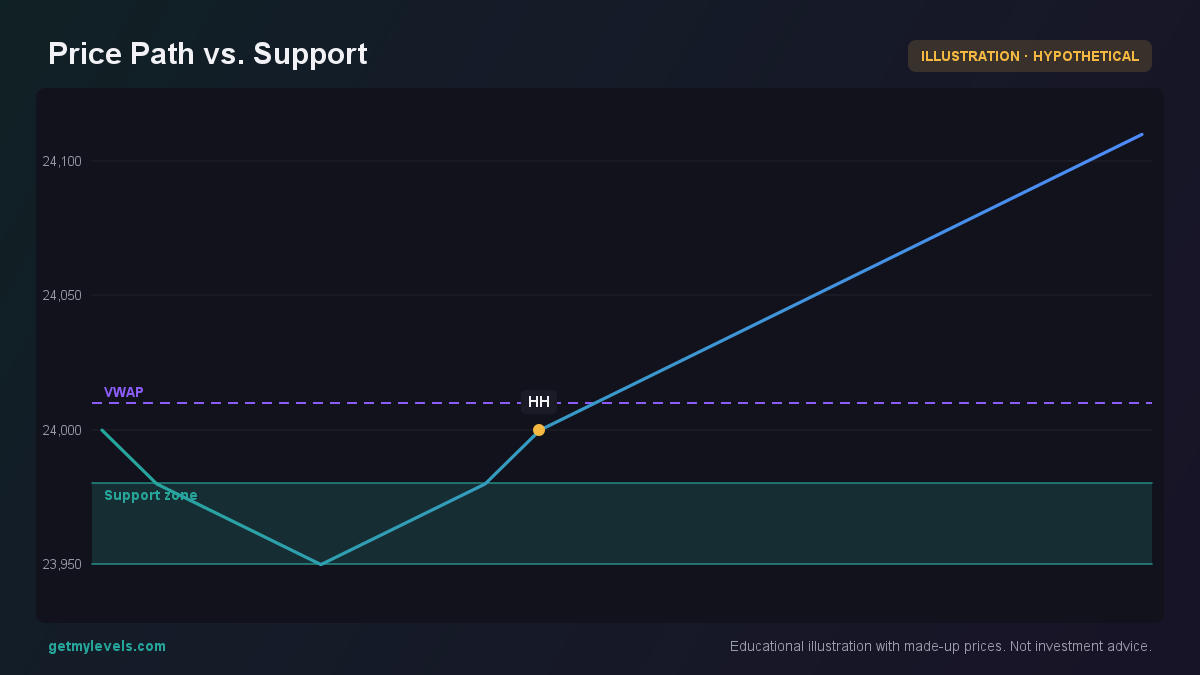 Figure 1: Price bounces off the support zone and stays above it.
In this scenario, the OI-Delta being positive aligns with the price staying above the support zone. A negative delta would have been a sign that the market might struggle to keep that support.
Interpreting the numbers
- Positive delta (+200): Slight call bias.
- Negative delta (–200): Slight put bias.
- Delta magnitude: The larger the absolute value, the stronger the bias, but keep it in context with the total OI and price movement.
When the OI-Delta swings from positive to negative (or vice versa) while price is near a key zone, it can signal that the sentiment is shifting. However, a single swing is rarely decisive; look for a trend in the delta over several days.
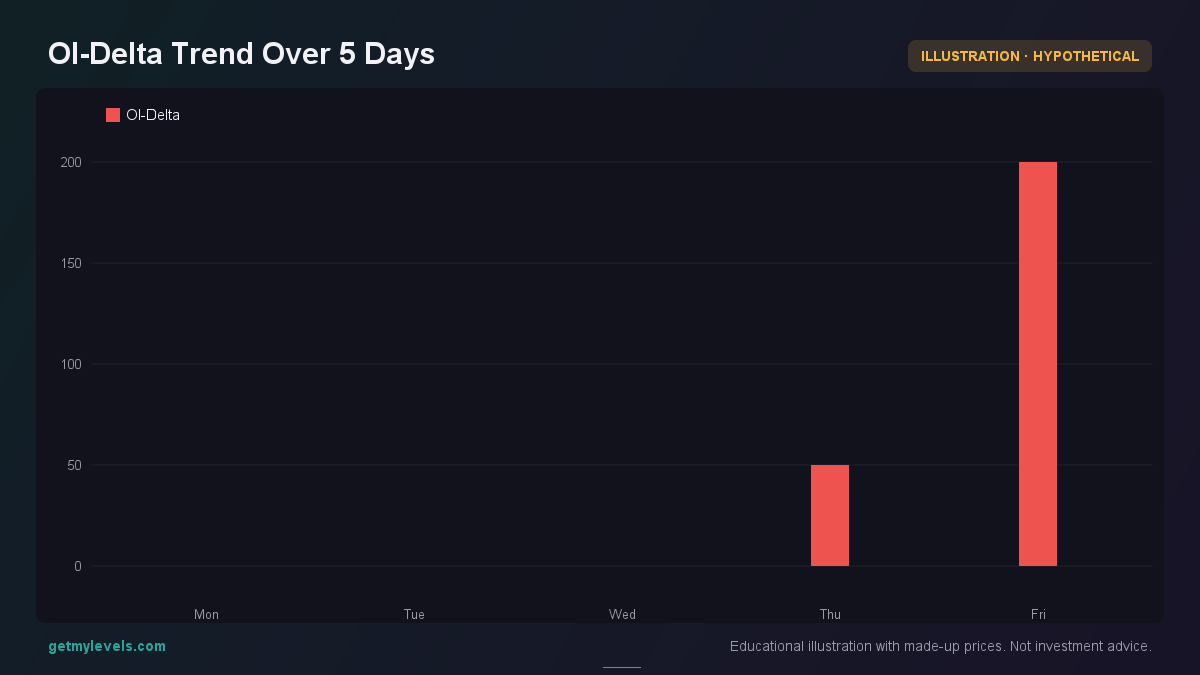 Figure 2: The OI-Delta rises from negative to positive, indicating a shift to a bullish bias.
Common mistakes
| Mistake | Why it’s a problem | How to avoid it |
|---|---|---|
| Reading delta as a direct buy/sell signal | Delta only shows exposure, not direction of price. | Use delta as a sentiment gauge, not a trade trigger. |
| Ignoring the size of the delta | A small delta may be noise. | Compare delta magnitude to total OI and price volatility. |
| Assuming delta equals price movement | Delta can lag or lead price depending on market conditions. | Combine delta with price structure and volume for confirmation. |
| Over-relying on a single strike | Delta varies across strikes. | Look at delta across a range of strikes around the current price. |
Remember, OI-Delta is one piece of a larger puzzle. It tells you what the options market is doing, but it does not dictate what the index will do next.
How it fits with support and resistance zones
Support and resistance zones are built from historic price levels across many timeframes. When OI-Delta is plotted on the same chart, you can see whether the market’s big-player exposure is aligned with these zones. For instance, a rising positive delta near a resistance zone might suggest that traders are piling up calls ahead of a potential breakout. Conversely, a falling negative delta near a support zone could indicate that puts are getting crowded, potentially foiling a bounce.
In practice, you can overlay the live support/resistance zones from GetMyLevels with the OI-Delta bars. The combination can give a clearer picture of whether the market is likely to test a zone or hold above it.
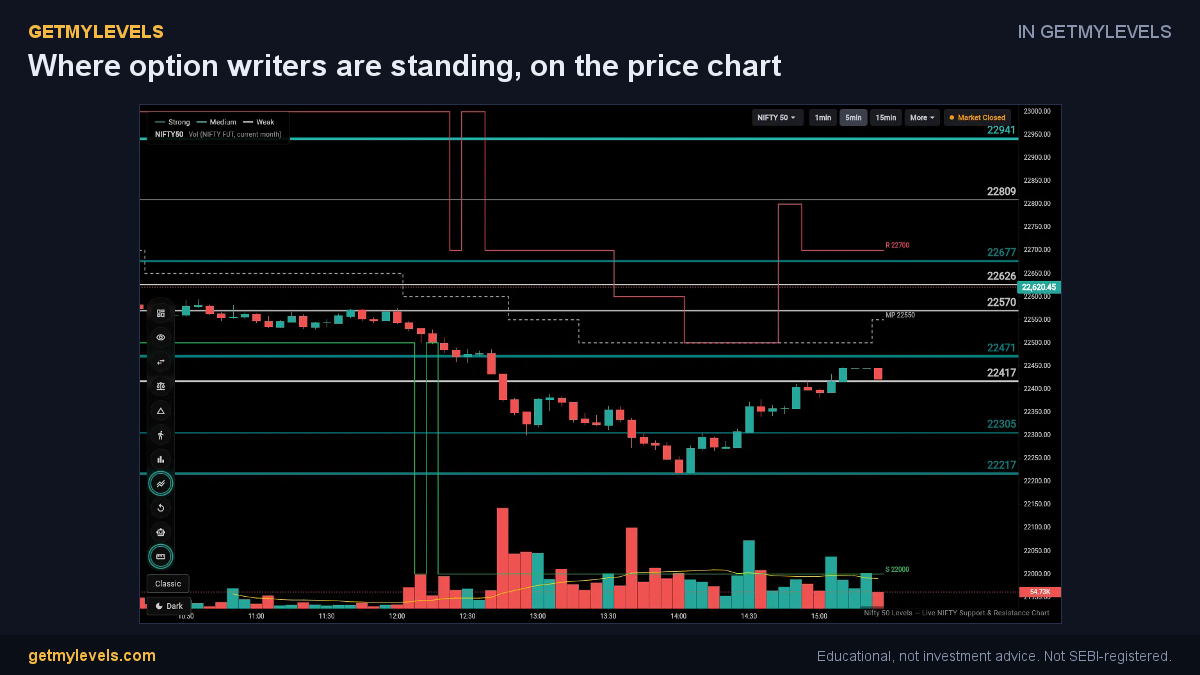 In GetMyLevels: Where option writers are standing, on the price chart. The live chart draws this for NIFTY, BANK NIFTY and SENSEX.
Summary
- OI-Delta shows the balance of call vs. put open interest; a positive value indicates a call bias, a negative value a put bias.
- Use delta trends over several days rather than single swings to gauge sentiment.
- Combine delta with price structure and volume for a more robust view.
- Watch how delta behaves near support and resistance zones; aligned movements can reinforce the significance of a zone.
- Remember that OI-Delta is a sentiment gauge, not a direct trade signal.
By adding OI-Delta to the live support/resistance zones on the GetMyLevels chart, you get a richer picture of what the market’s institutional participants are doing, helping you make more informed observations about short-term direction.
Written by an AI agent from GetMyLevels level data and checked by automated compliance rules. Educational, not investment advice. Not SEBI-registered.