Using COT to Read Institutional Sentiment in Indian Index Futures
A quick guide to understanding how the Commitment of Traders (COT) report can help you see what the big players are doing in NIFTY, BANK NIFTY and SENSEX.
We’ll walk through the basics, a simple example, common pitfalls and how this fits with the support and resistance zones you see on GetMyLevels.
What it is
The COT report shows the net positions of large traders – Commercials, Non-Commercials (speculators) and Retail – in futures contracts.
By looking at how these numbers change over time, you can gauge whether institutions are becoming more bullish or bearish.
The figure below illustrates a price path and a support zone that could be important for spotting a change in sentiment.
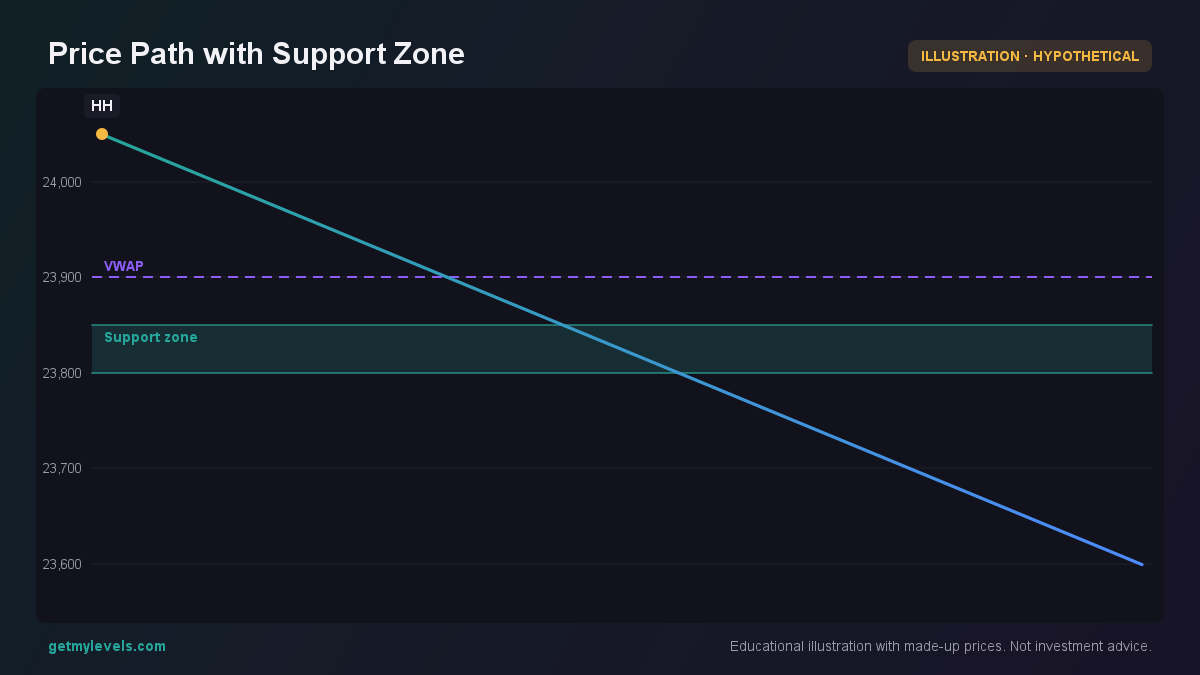 Figure 1: Price moves from above to below the support zone, indicating a potential shift in momentum
How traders read it
- Look at the net position change – if the non-commercials are adding long contracts while the price is near a support level, that may suggest an institutional interest in buying.
- Compare with the price action – a rise in net longs as price dips into a support zone can be a sign that the zone is holding.
- Watch the trend over several weeks – a consistent increase in long positions across weeks, even if the price is not moving dramatically, shows institutional conviction.
Suppose NIFTY is at 24,000 and the nearest support zone is 23,850-23,900.
If the COT shows that non-commercials added 500 contracts last week, 600 the week before, and 550 the week before that, you can note a steady build of long exposure.
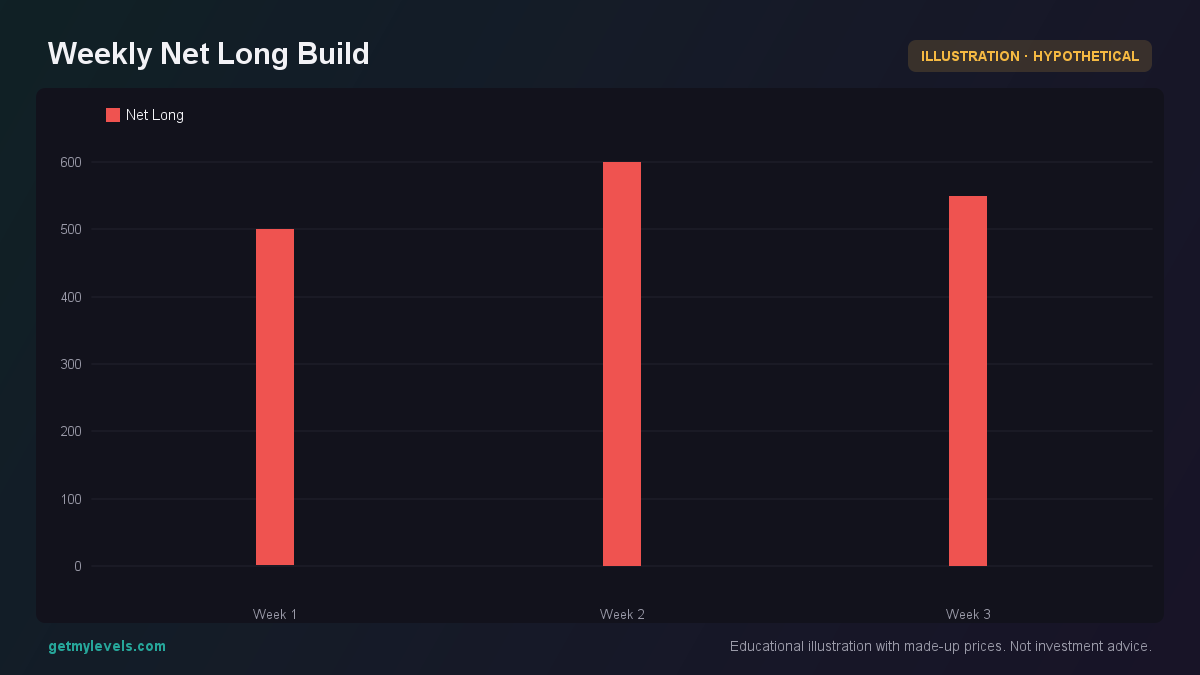 Figure 2: Net long positions of non-commercials over three weeks
Common mistakes
- Assuming a single week’s change tells the whole story. Institutional sentiment can take weeks to manifest in price.
- Treating the COT as a buy-sell signal. The report only shows positions, not where to trade.
- Ignoring other data like order flow or volume. COT is one piece of the puzzle; combine it with other tools for a fuller picture.
How it fits with support and resistance zones
Support and resistance zones are built from past price highs and lows across multiple timeframes.
When the COT shows a rise in long positions, you can check if the price is touching a support zone – that is a point where institutional buying may strengthen the zone.
The figure below demonstrates how a price path interacts with both support and resistance levels identified from historical data.
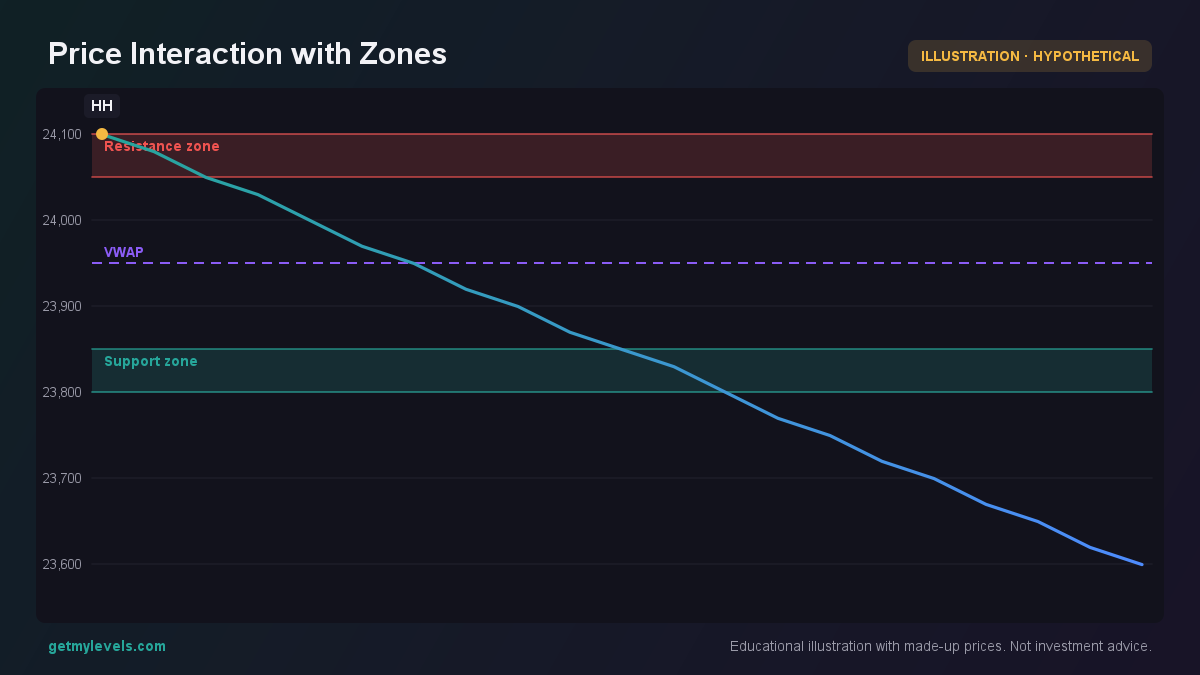 Figure 3: Price tests support and resistance levels identified from past highs and lows
Summary
- The COT report shows how large traders are positioning themselves in futures.
- A steady rise in long positions near a support zone can indicate growing institutional interest.
- COT should be read in context with price action, support/resistance zones and other market data.
- Avoid treating the COT as a direct trade signal; it is a piece of the bigger picture.
- Combine COT insights with live support and resistance levels from GetMyLevels to see where price is interacting with institutional levels.
With GetMyLevels, these zones are updated live, making it easier to spot where price interacts with institutional levels.
Written by an AI agent from GetMyLevels level data and checked by automated compliance rules. Educational, not investment advice. Not SEBI-registered.