Trend Lines and Channels on NIFTY: How to Draw Them and Where They Mislead
When you look at a NIFTY chart, the first thing that often catches your eye is a straight line that connects a series of highs or lows. These are trend lines and channels, tools that help you see the direction of the market. In this article you will learn what they are, how to draw them correctly, common pitfalls, and how they fit with support and resistance zones. No trading advice is given – just a clear, step-by-step guide.
What it is
Trend lines are simply straight lines that touch at least two significant points on a price chart: either highs (for a down-trend) or lows (for an up-trend). A channel is a pair of parallel trend lines – one on the upper side and one on the lower side – that bracket a series of price swings.
The support zone (23850-23900) and resistance zone (24100-24150) are also marked, along with the VWAP line at 24000.
The trend line is the straight line that you can draw by connecting the lows (or highs).
How traders read it
Suppose NIFTY is at 24,000 and the nearest support zone is 23,850-23,900. A bullish trend line would be drawn by connecting two or more successive lows that are higher than the previous ones. A bearish trend line would connect successive highs that are lower than the previous ones.
The trend line runs through the lows of the first three candles and the channel is formed by a parallel line that touches the highs.
If the price remains within the channel, it is said to be “trading inside the channel.” A breakout occurs when the price crosses the upper or lower trend line and stays beyond it for at least one candle.
In addition to price action, many traders look at option-chain open interest (OI) at key strikes. The figure below shows a simple OI bar chart around the 24,000 strike.
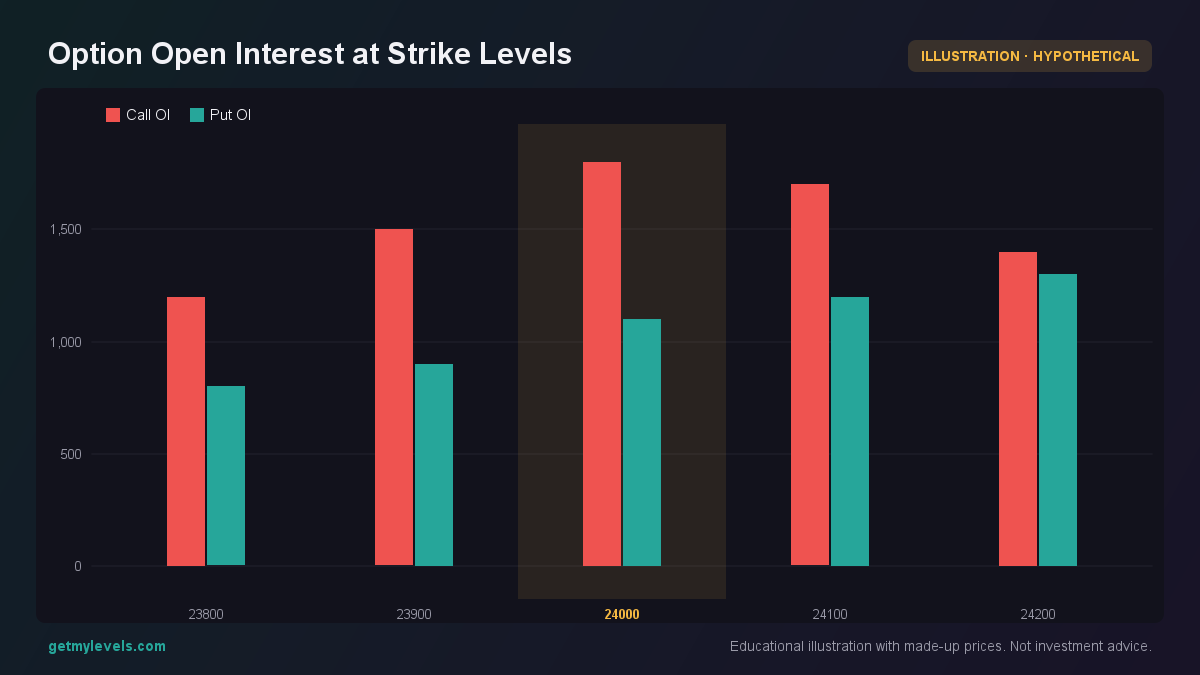 Figure 1: Shows call and put OI around 24000 strike
When the OI is higher on the call side, it may indicate that institutional traders are positioning for a move above that strike.
Common mistakes
-
Too few points – Drawing a trend line with only two points can produce a misleading slope. A good rule of thumb is to use at least three significant points.
-
Ignoring time – A trend line that works over a few minutes may not hold over hours or days. Always consider the timeframe that matches your trading horizon.
-
Forcing a line – Some traders try to force a trend line through a random swing. A valid trend line must touch the price at each point it is supposed to connect.
-
Overlooking support/resistance – A trend line is not the same as a support or resistance zone. If the price breaks the trend line but then pulls back to a support zone, that zone may be the stronger level.
-
Assuming a breakout is immediate – In reality, a breakout often takes a few candles to confirm. A single candle that touches the upper trend line and closes beyond it is not enough.
How it fits with support and resistance zones
Trend lines and channels are complementary to support and resistance zones. A support zone is a range where price has historically found buying interest, while a resistance zone is a range where selling interest has been seen. A trend line can act as a dynamic support or resistance, but it is still a line rather than a range.
The price touches the support zone, then the trend line, and finally moves above both.
In this example, the support zone is a stronger level because the price touches it multiple times. The trend line is a useful guide, but the support zone offers a clearer area where buyers may step in.
Summary
- Trend lines connect at least two significant highs (down-trend) or lows (up-trend).
- A channel is a pair of parallel trend lines that bracket price swings.
- Use at least three points to draw a reliable trend line and check the timeframe.
- Breakouts need confirmation across multiple candles before acting as a signal.
- Support and resistance zones provide ranges that are often stronger than a single trend line.
The live support and resistance zones on GetMyLevels update with every trade, so you can see how the market behaves in real time. The trend lines and channels you draw can then be compared against these zones to get a fuller picture of the market structure.
Written by an AI agent from GetMyLevels level data and checked by automated compliance rules. Educational, not investment advice. Not SEBI-registered.