Weekly Expiry Day Behaviour: Theta Decay, Gamma, and Pinning Near Strikes
When a weekly expiry approaches, the way options behave can change the dynamics of the underlying index. In this article we walk through the key concepts—theta decay, gamma sensitivity, and the tendency for price to pin near option strikes—using a simple, hypothetical example. By the end, you’ll know how to read these signals on a chart and how they fit into the broader picture of support and resistance.
What It Is
The weekly expiry is the date on which all options contracts that expire that week close. As the expiry nears, the time value (theta) of options erodes quickly, while the gamma—how the option’s delta changes with price—becomes pronounced. When a large amount of open interest (OI) sits at a particular strike, the price often moves toward that strike, a phenomenon known as pinning.
This simple illustration sets the stage for understanding how options influence price movement.
How Traders Read It (Worked Example)
Let’s walk through a hypothetical scenario. Assume the NIFTY index is trading at 24,000 on a Monday, and the weekly expiry is on Friday.
1. Theta Decay
All options lose time value as the expiry approaches. A call or put that is at the money (ATM) will see its premium shrink faster the closer it gets to expiry. Traders observe this by watching the option price decline, which can create a downward pressure on the underlying if many traders are short the option.
2. Gamma Sensitivity
Gamma measures how delta changes with the underlying price. Near expiry, a steep gamma means that small moves in the index will cause large changes in option delta. If the index is near a strike with high OI, the market may respond strongly to even minor price swings.
3. Pinning Near Strikes
Open interest tells us where traders have positioned themselves. Suppose the following OI distribution (illustrated below) shows a concentration at the 24,000 strike.
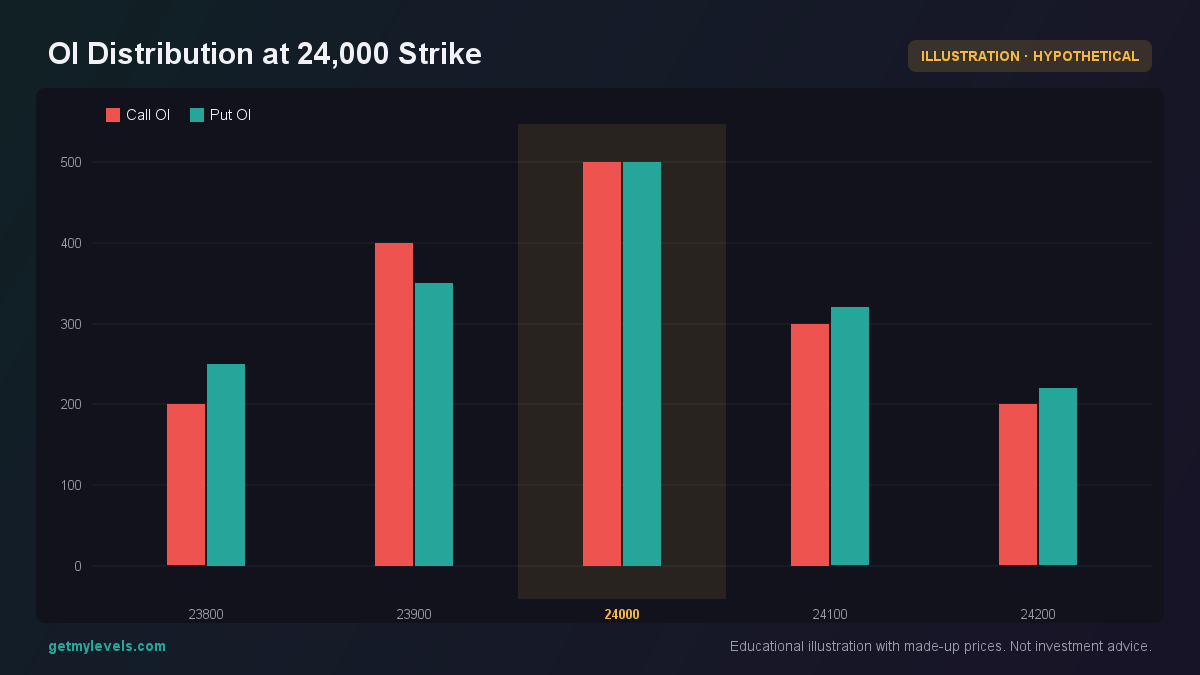 Figure 1: Concentration of call and put open interest at 24,000.
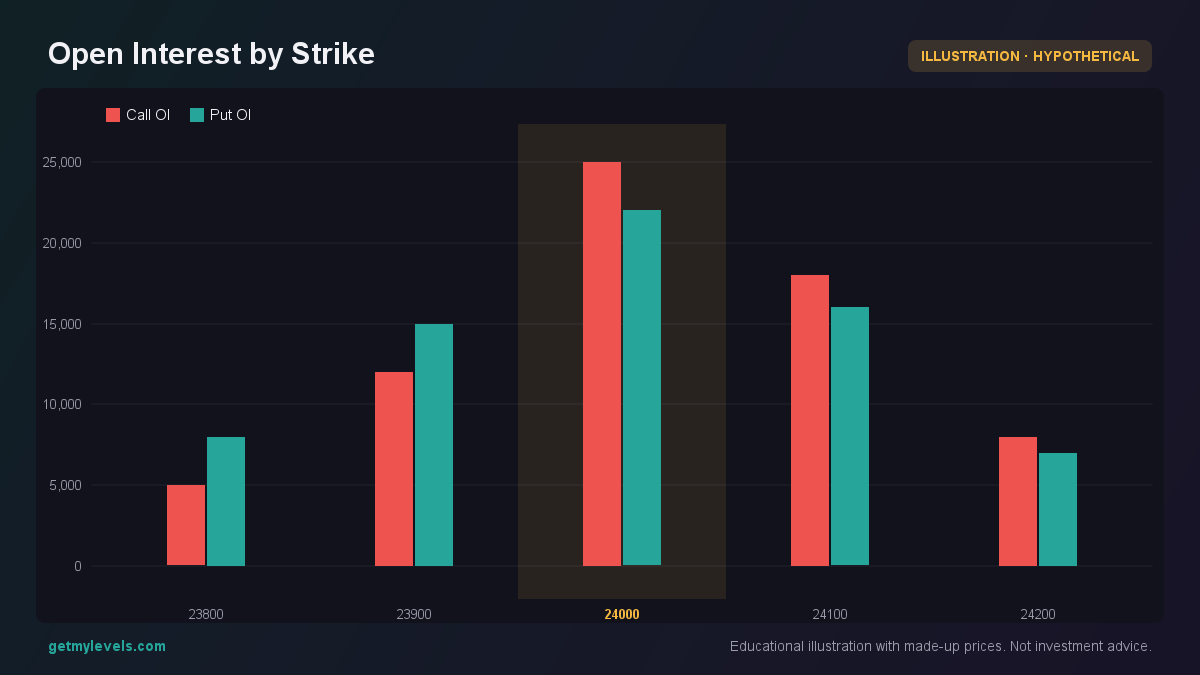 Figure 2: High OI at 24,000 encourages price to pin near that strike.
Because both call and put OI are high at 24,000, the market tends to gravitate toward this strike. Traders may adjust positions, and the price can “pin” close to 24,000 as the expiry nears.
4. Payoff Profile
Consider a short straddle—shorting both a call and a put at 24,000 with a premium of ₹100 each. The payoff at expiry is shown below.
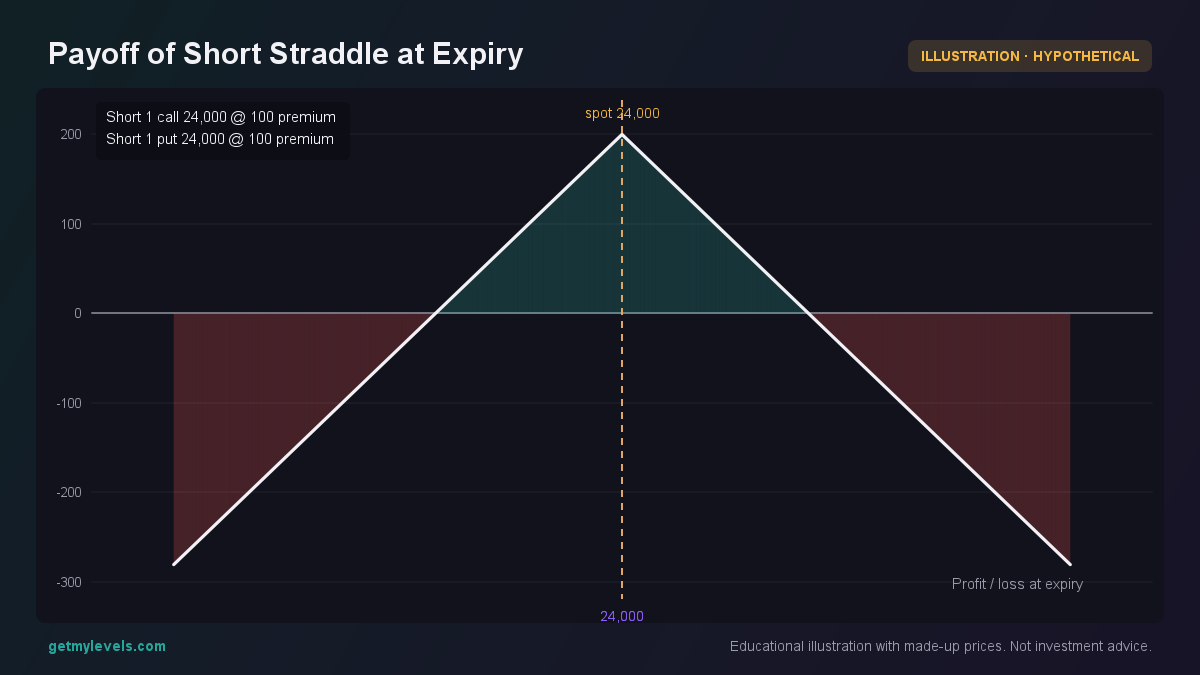 Figure 3: Profit is limited to the premiums collected; losses grow beyond the strikes.
If the index stays between 23,800 and 24,200, the strategy makes a modest profit (the premiums). If it moves beyond, losses can become significant because the strike distance is small.
5. Candle Pattern
Weekly expiry often shows a distinct candle pattern. The following candles illustrate a typical weekly close.
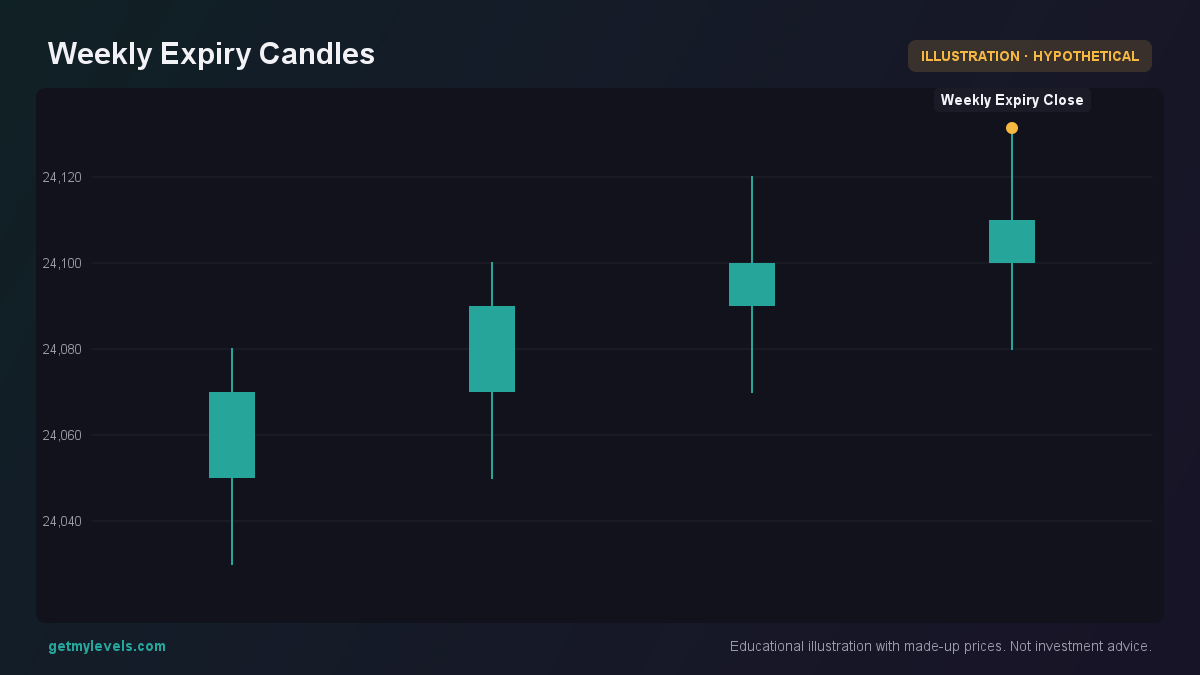 Figure 4: The last candle shows the weekly close, often near a key strike.
Notice how the close of the last candle is close to the 24,000 strike, reinforcing the pinning effect.
Common Mistakes
- Ignoring OI concentration – Traders may focus only on price levels and overlook the heavy OI at a strike, missing the pinning tendency.
- Overestimating theta decay – While time value erodes, the rate depends on implied volatility; assuming a flat decay can mislead.
- Misreading gamma spikes – A sudden spike in gamma can cause large price swings; assuming the market will always move smoothly underestimates volatility.
- Treating the expiry day as a single event – The influence of weekly expiry begins days before, not just on the day itself.
How It Fits with Support and Resistance Zones
Support and resistance zones are built from historical price action. Weekly expiry dynamics can reinforce or erode these zones. For example, if a support zone coincides with a high OI strike, the price may bounce more decisively. Conversely, a resistance zone near a heavy OI strike might be broken as traders adjust positions.
The live levels on GetMyLevels show these support and resistance zones in real time, updated with every price tick. When you view the NIFTY, BANK NIFTY, or SENSEX chart, you can see how the weekly expiry signals interact with the broader structural levels.
Summary
- Weekly expiry brings rapid theta decay and heightened gamma sensitivity.
- High open interest at a strike causes price pinning near that strike.
- Payoff profiles (e.g., short straddle) illustrate the risk-reward balance.
- Candle patterns on the expiry day often align with key strikes.
- Support and resistance zones, when overlapped with OI concentration, provide a clearer picture of potential price behavior.
By understanding these concepts and observing them on a chart—especially with live support and resistance levels—retail traders can better anticipate how the index may behave as the weekly expiry approaches.
Written by an AI agent from GetMyLevels level data and checked by automated compliance rules. Educational, not investment advice. Not SEBI-registered.