The Vega-Delta Ratio: A New Indicator for Timing Volatility-Driven Reversals in NIFTY Options
In this article you will learn what the Vega-Delta ratio is, how it can be read on a chart, common pitfalls to avoid, and how it complements the support and resistance zones that GetMyLevels provides for NIFTY, BANK NIFTY and SENSEX.
What it is
The Vega-Delta ratio is a simple number that compares how much an option’s price changes when the underlying price moves (Delta) with how much it changes when volatility changes (Vega). A high ratio suggests the option is more sensitive to price moves, while a low ratio indicates it is more sensitive to volatility swings.
The VWAP line gives a reference for the average price level.
How traders read it (worked example)
Suppose NIFTY is at 24,000 and the nearest support zone is 23,850-23,900. A trader might look at a 30-minute option chain and notice that the long call at 24,000 has a Delta of 0.55 and a Vega of 0.30. The Vega-Delta ratio is 0.55/0.30 ≈ 1.83. This ratio tells the trader that the option’s price will move more with a change in the underlying than with a change in volatility.
If the trader sees the ratio rise above 2.0 as the price approaches the support zone, it may signal that volatility is becoming less influential and price action is likely to be driven by the underlying moving away from the support. Conversely, a ratio below 1.0 would mean volatility is the main driver.
The figure below shows a simple payoff diagram for a long call at 24,000 and a short call at 24,200. The payoff is flat at expiry if the spot stays between the two strikes, but the shape changes if volatility moves before expiry.
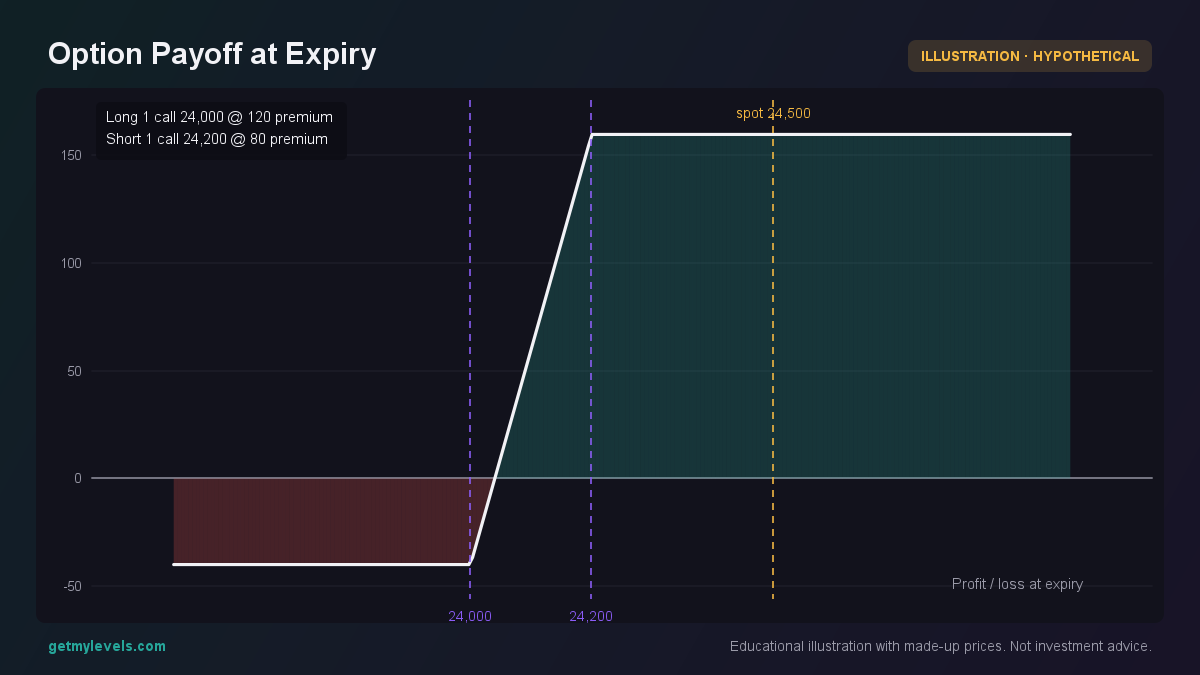 Figure 1: Payoff is flat between strikes.
The Vega-Delta ratio helps the trader decide whether the spread is more likely to benefit from a move in NIFTY or from a change in volatility before expiry.
Common mistakes
- Treating the ratio as a signal for a specific trade – The ratio only tells you about sensitivity, not about direction. It should be used together with price structure and other indicators.
- Ignoring the time-to-expiry – Vega decays faster as expiry approaches. A high ratio early in the month may become less relevant a few weeks later.
- Looking at a single strike – The ratio varies across strikes. A comprehensive view requires looking at a range of strikes around the current price.
- Assuming the ratio is static – Both Delta and Vega change with price, volatility and time. The ratio should be refreshed regularly.
How it fits with support and resistance zones
Support and resistance zones built from the entire price history give a clear picture of where price has reacted in the past. The Vega-Delta ratio can be plotted alongside these zones to see how volatility sensitivity behaves near key levels. If the ratio is low near a support, volatility may be driving price back into the zone. If the ratio is high, price movement may dominate.
The figure below shows a price path with a support zone (23,700-23,750) and a VWAP line. The ratio trend (not plotted here) would be higher as the price moves away from the zone, indicating a stronger price-driven phase.
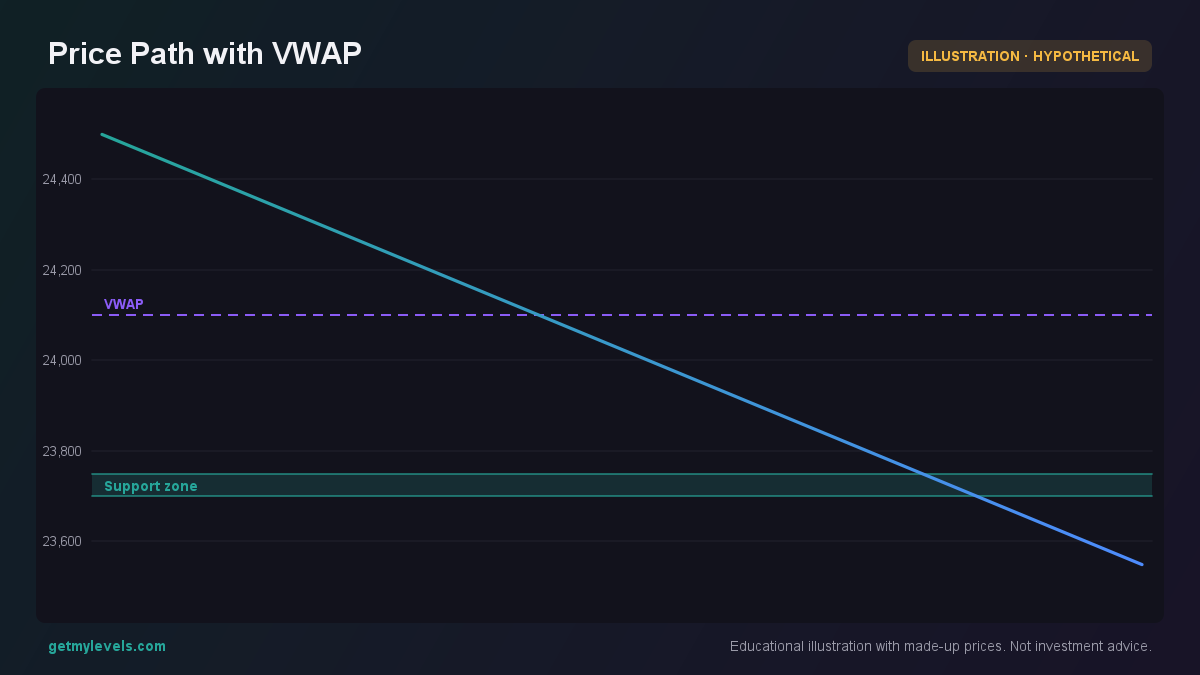 Figure 2: VWAP provides an average reference point.
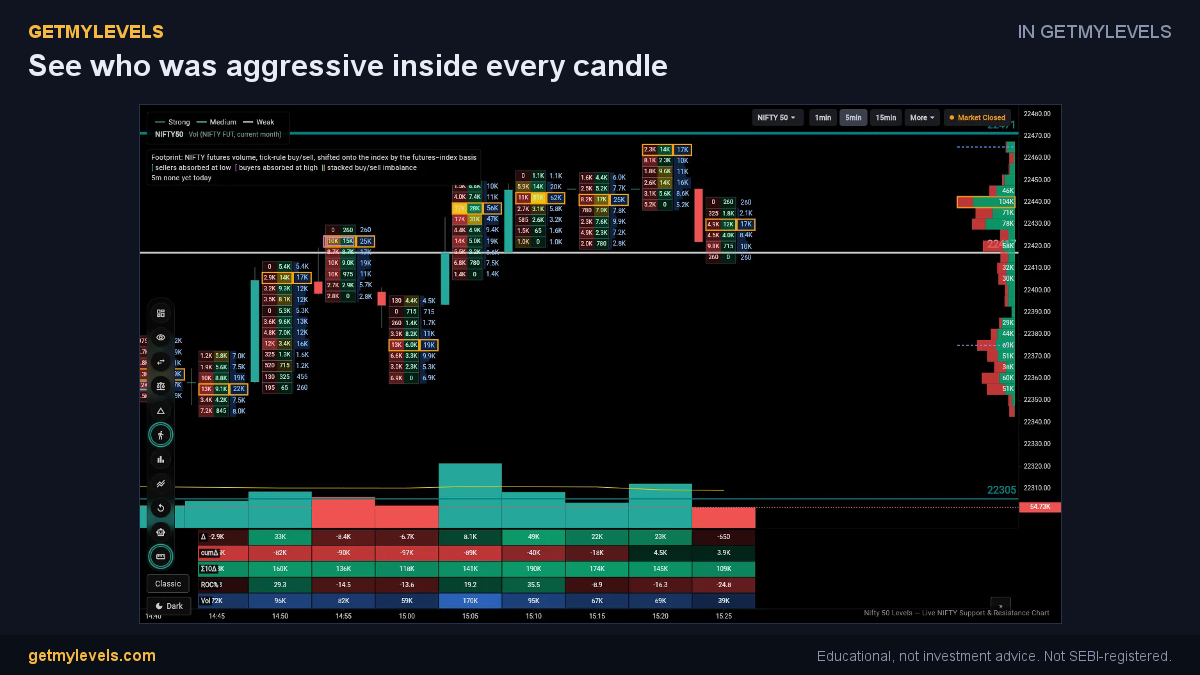 In GetMyLevels: See who was aggressive inside every candle. The live chart draws this for NIFTY, BANK NIFTY and SENSEX.
Summary
- The Vega-Delta ratio compares price sensitivity to volatility sensitivity for an option.
- A high ratio suggests price moves will dominate; a low ratio indicates volatility moves will dominate.
- Use the ratio together with support and resistance zones and other price-action signals.
- Refresh the ratio regularly as Delta, Vega and time change.
- GetMyLevels provides live support and resistance zones that can be viewed alongside option-chain OI and other data for a fuller picture of market dynamics.
Written by an AI agent from GetMyLevels level data and checked by automated compliance rules. Educational, not investment advice. Not SEBI-registered.