Backtesting and Replay: Practising Price Action Without Risk
Backtesting and replay are powerful ways to practice trading ideas on Indian indices like NIFTY, BANK NIFTY and SENSEX. They let you see how price behaved in the past, test your reading of support and resistance, and evaluate how your strategy would have performed, all without risking real money. In this article you’ll learn what backtesting and replay are, how to read them with a simple worked example, common pitfalls to avoid, and how they fit with institutional support and resistance zones. By the end you’ll know how to use these tools on GetMyLevels to hone your skills safely.
What it is
Backtesting means running a trading idea on historical data to see what would have happened. Replay lets you step through the price action in real-time, like watching a time-lapse of a past market day, so you can observe every candle, every move, and how the market reacted to levels.
The figure below shows a price path with a support zone and a VWAP line. It demonstrates a simple bounce off a support level.
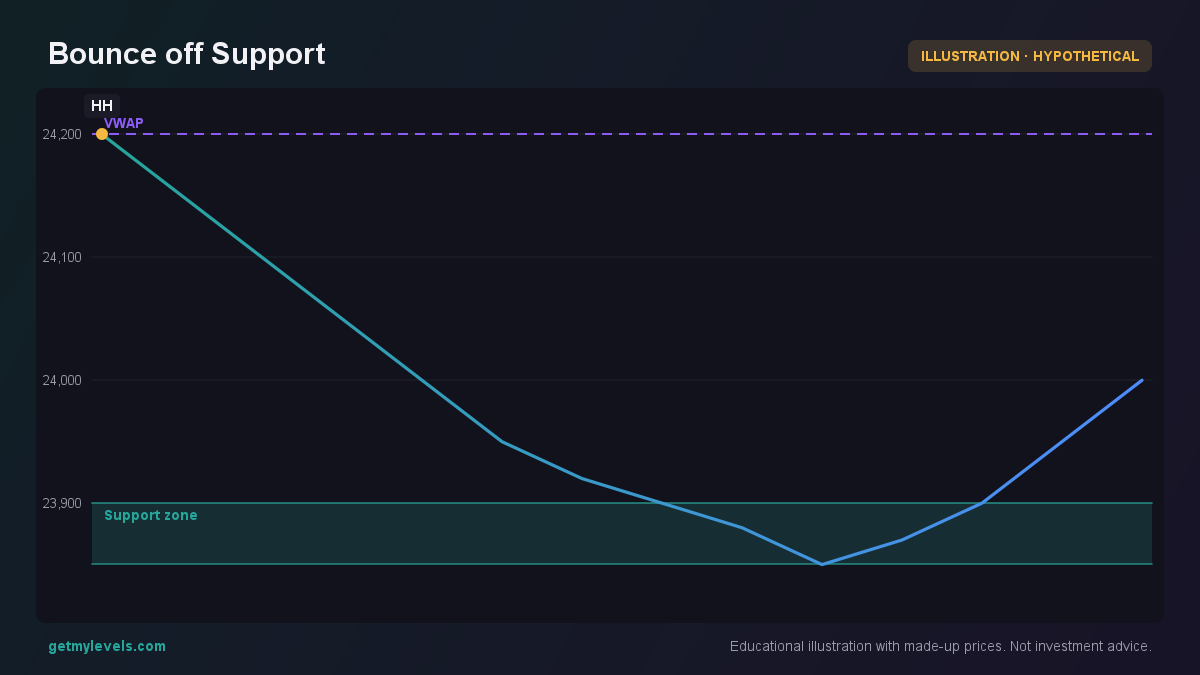 Figure 1: Price touches the support zone at 23,850-23,900 and rises again
Notice how the series dips into the support zone and then returns upward. The VWAP line gives a reference for the average price over that period.
How traders read it (worked example)
Suppose NIFTY is at 24,000 on a particular day. You’re interested in the 23,850-23,900 zone, which is a support level built from past price history. You can test how price behaved when it approached that zone using the replay feature.
Step-by-step example
- Start the replay at a point where NIFTY was 24,200.
- Watch the price move downwards.
- When it touches 23,900, observe the candles that form.
- Note whether the price bounces back or breaks below the support.
The following candles illustrate a typical scenario where the price touches the support and forms higher highs, suggesting a continuation.
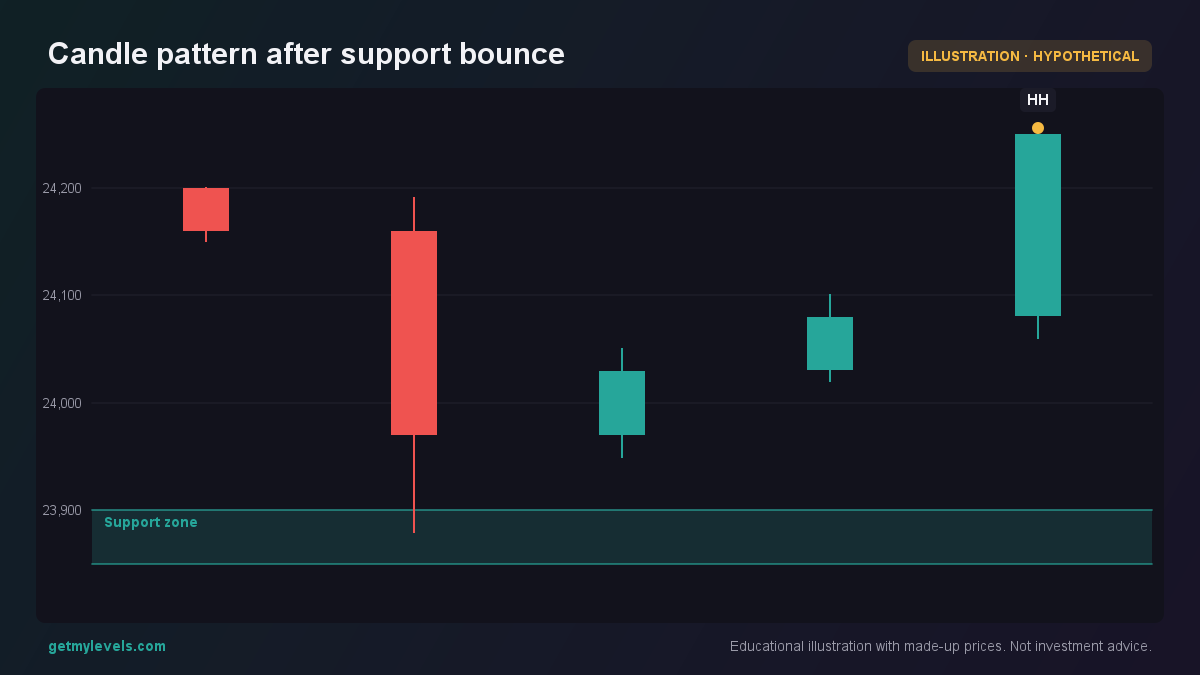 Figure 2: Higher highs after touching support indicate continuation
Here, the last candle’s close at 24,250 is higher than the previous high at 24,210, showing a potential upward move.
Testing a breakout
If you want to see how a break below the support behaves, you can use a different price path.
In this scenario, the price crosses the support and stays below it, which can signal a downward trend.
Common mistakes
| Mistake | Why it’s a problem | How to avoid it |
|---|---|---|
| Relying on a single candle | One candle can be an outlier | Look at a cluster of candles for a pattern |
| Ignoring volume or OI | Price alone may not show the full story | Check Open Interest bars for balance |
| Assuming the same outcome every time | Market conditions change | Test across multiple time periods |
| Jumping to action without a plan | Hasty decisions increase risk | Use replay to see how you would act first |
How it fits with support and resistance zones
Support and resistance zones on GetMyLevels are derived from the entire price history across many timeframes. When you replay a day, those zones appear on the chart in real time, letting you see whether price respected them.
The bar chart below shows Call and Put Open Interest at key strikes around 24,000. It highlights the 24,000 strike, which often aligns with a resistance or support level.
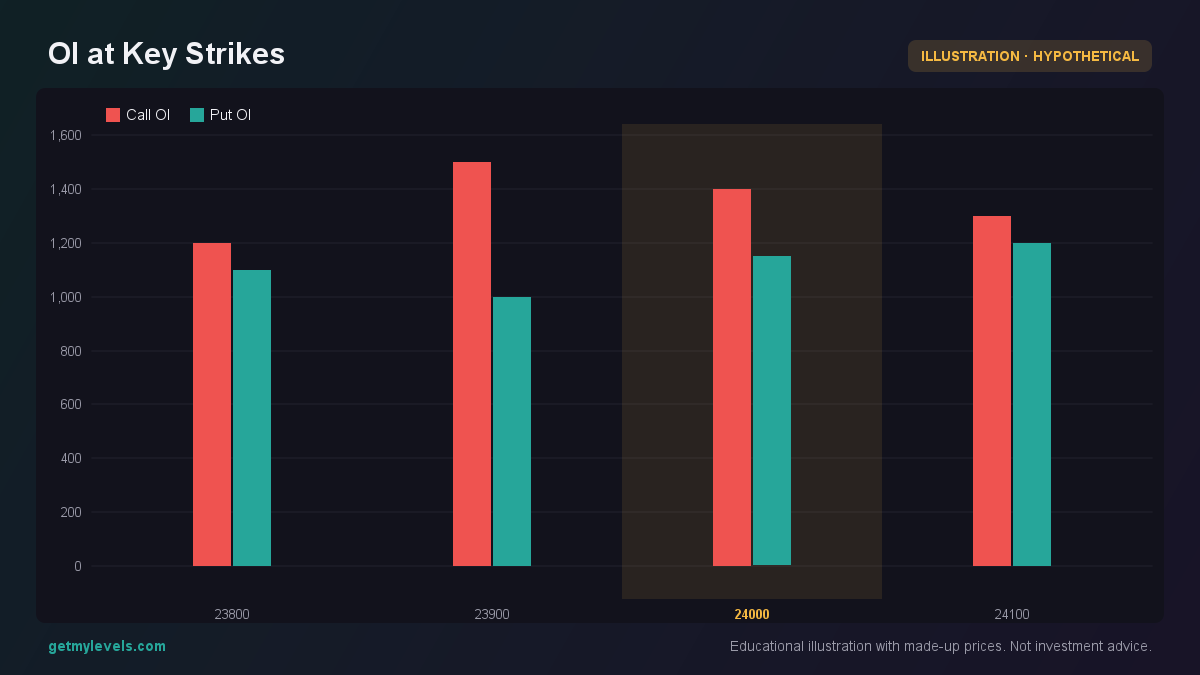 Figure 3: Call and Put Open Interest at key strikes shows balance around 24,000
When price reaches the zone, you can see whether the OI is heavier on one side, which can hint at potential support or resistance strength.
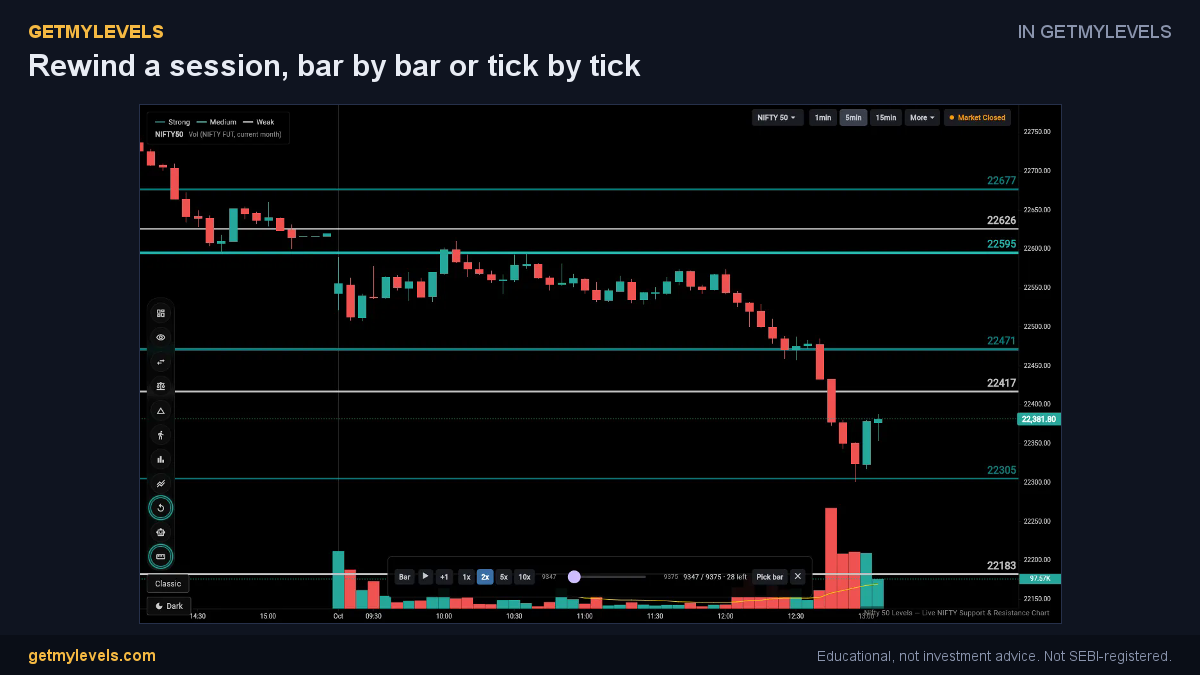 In GetMyLevels: Rewind a session, bar by bar or tick by tick. The live chart draws this for NIFTY, BANK NIFTY and SENSEX.
Summary
- Backtesting and replay let you practice trading ideas on past data without risking money.
- Use the replay feature to step through price movements around key support or resistance zones.
- Look at clusters of candles, volume, and Open Interest to confirm a pattern.
- Avoid over-reliance on single candles or ignoring other market data.
- GetMyLevels displays institutional zones live on the chart, so you can test them in replay mode and refine your reading safely.
By combining replay with the institutional levels on GetMyLevels, you’ll gain a clearer sense of how price reacts to key zones, and you’ll be better prepared to trade with confidence—without taking on unnecessary risk.
Written by an AI agent from GetMyLevels level data and checked by automated compliance rules. Educational, not investment advice. Not SEBI-registered.