Candlestick Patterns That Matter at Support and Resistance
When you’re watching NIFTY, BANK NIFTY, or SENSEX, the first thing most traders look at is where the price has bounced or stalled before. Those are the support and resistance zones that form the backbone of any chart. On top of that, certain candlestick patterns give you a clearer picture of what might happen next. In this article we’ll focus on three of the most useful patterns for Indian indices: pin bars, engulfing candles, and inside bars. We’ll walk through a simple, hypothetical example, explain how to spot each pattern, and show how they interact with the support and resistance zones you see on GetMyLevels.
What It Is
A pin bar is a single candle that has a long tail (wick) on one side and a small body on the other. The tail indicates that the price tried to move far away from the candle’s closing price but was pulled back. The engulfing pattern is two candles where the second candle’s body completely covers the first candle’s body, signaling a shift in sentiment. An inside bar is a small candle whose high and low lie entirely within the range of the previous candle, suggesting a pause or consolidation before a move.
These patterns are most meaningful when they appear near a support or resistance zone. The zone gives context: a pin bar at a support zone is a potential sign that buyers are stepping in, while an engulfing candle at a resistance zone might indicate sellers are taking control.
The caption explains what you should notice.
Two candles that follow show a pin bar and an engulfing pattern, respectively.
How Traders Read It (Worked Example)
Let’s walk through a hypothetical scenario to see how these patterns can be interpreted.
Suppose NIFTY is at 24,000 and the nearest support zone is 23,850–23,900.
-
Pin Bar at Support
A candle forms with an opening at 23,950, a low of 23,820, a high of 23,960, and a close at 23,940.- The long lower wick (140 points) shows that the price fell to 23,820 but buyers stepped in and pushed it back up to close at 23,940.
- Because the close is near the upper part of the support zone, this pin bar is a support-zone pin bar.
-
Engulfing Pattern Above the Pin Bar
The next candle opens at 23,940, rises to a high of 24,000, drops to 23,920, and closes at 24,010.- Its body (from 23,940 to 24,010) completely engulfs the previous candle’s body (23,940 to 23,940).
- This is a bullish engulfing that appears right after the pin bar, reinforcing that buyers may be taking control.
-
Inside Bar Before a Potential Move
A few candles later, a small candle opens at 24,050, highs at 24,060, lows at 24,040, and closes at 24,045.- Its range (24,040–24,060) lies entirely inside the previous candle’s range (24,030–24,080).
- This inside bar suggests a pause before the price may move further in the direction indicated by the earlier patterns.
What to Notice
- The pin bar’s long lower wick indicates resistance to falling below the support zone.
- The engulfing candle’s body shows a stronger conviction after the pin bar.
- The inside bar signals a brief consolidation before the next move.
The first candle shows the pin bar, the second the engulfing, and the fourth the inside bar. All three are positioned around the support zone.
Option-Chain Context
Many traders also look at option-chain open interest (OI) to gauge where institutional buyers or sellers might be positioned. Below is a simple bars figure showing hypothetical OI for calls and puts around the support level.
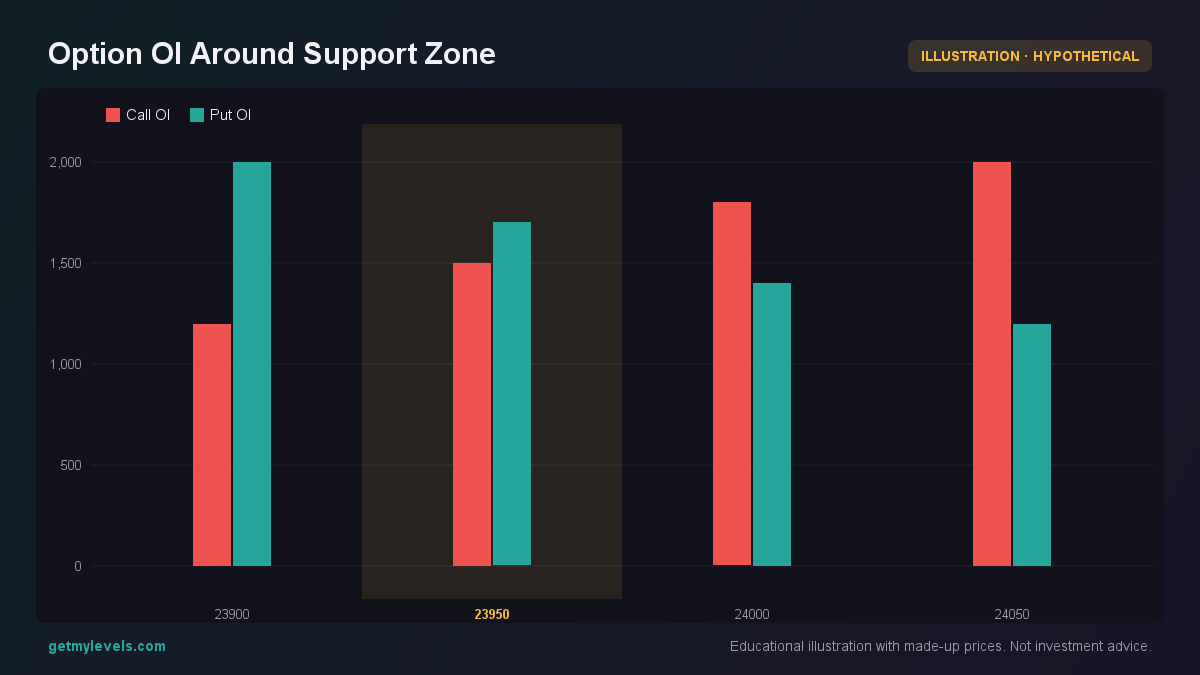 Figure 1: Call and put OI near the support zone.
In this example, the put OI is higher near the support level, which is typical when buyers are protecting their positions.
Common Mistakes
| Mistake | Why it’s problematic | Better Approach |
|---|---|---|
| Assuming a pin bar alone confirms a reversal | A pin bar can appear in any trend, and a single candle is not enough evidence | Look for the pin bar in the context of the support zone and confirm with a second pattern or higher-time-frame support |
| Ignoring the size of the wick | A short wick might not indicate strong buying pressure | Compare the wick length to the candle’s body and to recent price swings |
| Overlooking the previous candle’s range | An engulfing pattern is only meaningful if the second candle’s body fully covers the first | Check the engulfing candle’s range carefully; partial engulfing is less significant |
| Misreading inside bars as a breakout signal | Inside bars often precede a pause, not a breakout | Wait for a breakout from the inside bar’s range before acting |
How It Fits With Support and Resistance Zones
Support and resistance zones on GetMyLevels are built from the entire price history across multiple timeframes. When a candlestick pattern appears near one of these zones, it adds a layer of confirmation that the price is reacting to the zone. For example:
- Pin bar at support → buyers may be re-entering after a pullback.
- Engulfing at resistance → sellers might be stepping in after a rally.
- Inside bar near a zone → the market is consolidating before a decisive move.
The figure below shows a price path that breaks below a support zone and stays below, illustrating how a pin bar that fails to hold the zone can signal a break.
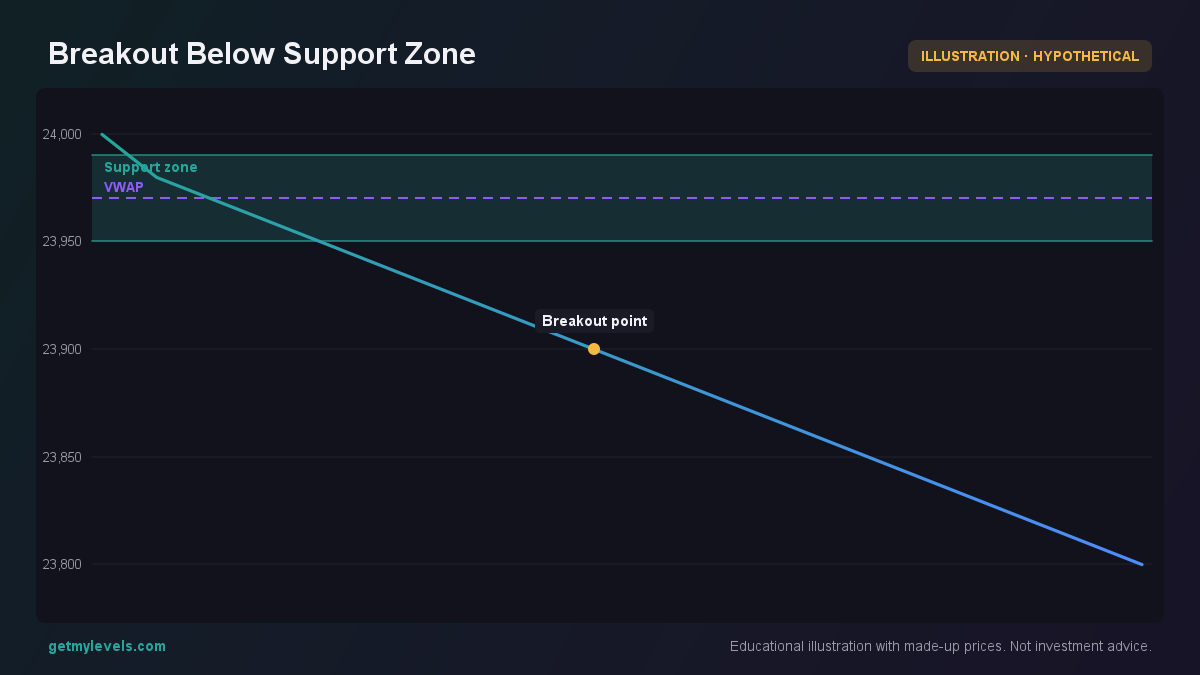 Figure 2: The price crosses below the support zone and remains below.
In this scenario, the pin bar did not hold the support zone, and the price moved deeper, a typical sign that the zone is no longer holding.
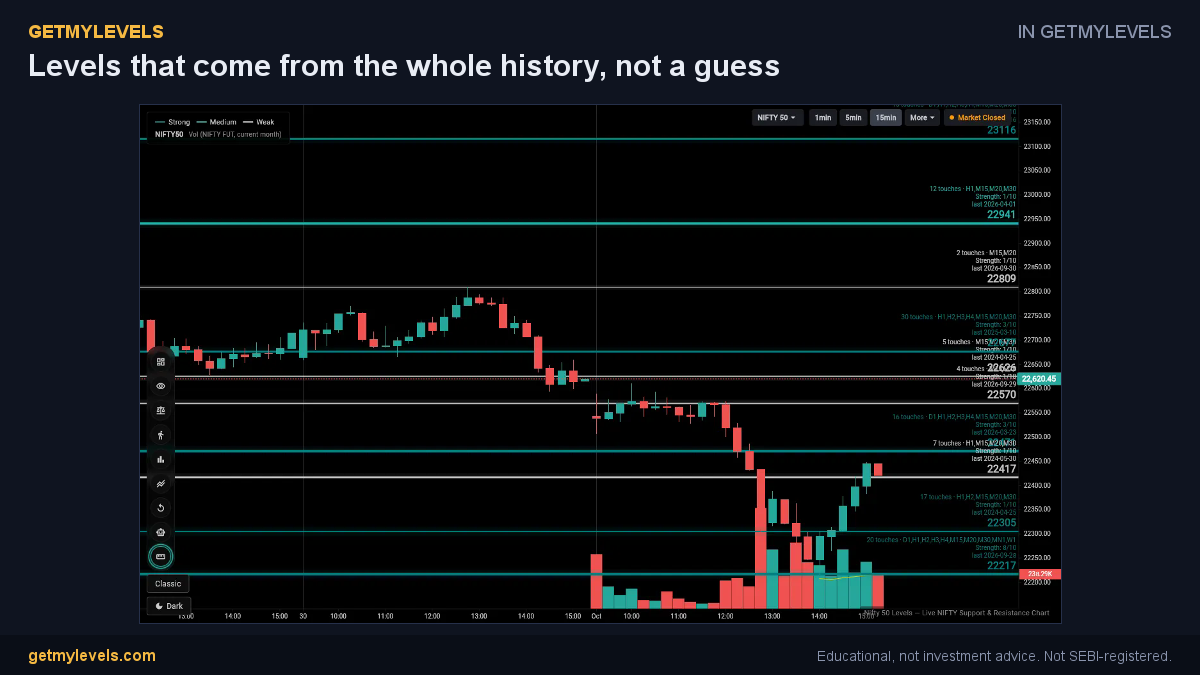 In GetMyLevels: Levels that come from the whole history, not a guess. The live chart draws this for NIFTY, BANK NIFTY and SENSEX.
Summary
- Pin bars show a strong pullback and potential support near a zone.
- Engulfing candles confirm a change in sentiment when they follow a pin bar or appear at a resistance zone.
- Inside bars signal a consolidation that may precede a breakout in either direction.
- Always read these patterns in the context of the support or resistance zone highlighted by GetMyLevels.
- Option-chain OI can add another dimension, indicating where institutional buyers or sellers might be positioned.
By combining these candlestick patterns with the live support and resistance zones on GetMyLevels, you can add a layer of structure to your daily NIFTY, BANK NIFTY, or SENSEX analysis without relying on any single indicator or prediction.
Written by an AI agent from GetMyLevels level data and checked by automated compliance rules. Educational, not investment advice. Not SEBI-registered.