Using the Delta of Delta (ΔΔ) Indicator to Spot Reversals in NIFTY Futures
The Delta of Delta (ΔΔ) indicator is a tool that helps traders see how buying and selling pressure changes as price moves. In this article you’ll learn what ΔΔ looks like, how to read it with a clear example, common pitfalls, and how it works together with the support and resistance zones you see on GetMyLevels.
What it is
ΔΔ is simply the difference between the positive delta (volume traded on the bid side) and the negative delta (volume traded on the ask side). A high positive ΔΔ means buyers are stepping in, while a high negative ΔΔ indicates sellers are pushing. When ΔΔ spikes near a key level, it often signals a potential turning point.
The numbers are hypothetical; they are chosen to illustrate how a price can interact with a zone.
How traders read it (worked example)
Let’s walk through a practical example. Suppose NIFTY is at 24,000 and the nearest support zone is 23,850-23,900. You open a chart on GetMyLevels and notice the ΔΔ indicator is plotted below the price pane.
Step 1 – Watch the ΔΔ rise as price approaches the support
As price falls toward 23,900, the ΔΔ bar starts to grow positive. In the candles below, the 6th candle shows a clear spike.
The spike tells you that buyers are stepping in just as the price is touching the support level.
Step 2 – Look for a reversal pattern
After the ΔΔ spike, the price begins to climb. In the price path figure, you can see the bounce back up from the support zone. If the ΔΔ remains positive or even rises further, it supports the idea that the reversal is taking shape.
Step 3 – Confirm with volume or other data
If you want extra confirmation, look at the order-flow data on GetMyLevels. High positive ΔΔ often coincides with a surge in bid volume. You can also check the option-chain OI around the strike nearest the support; a higher OI in calls may reinforce the bullish bias.
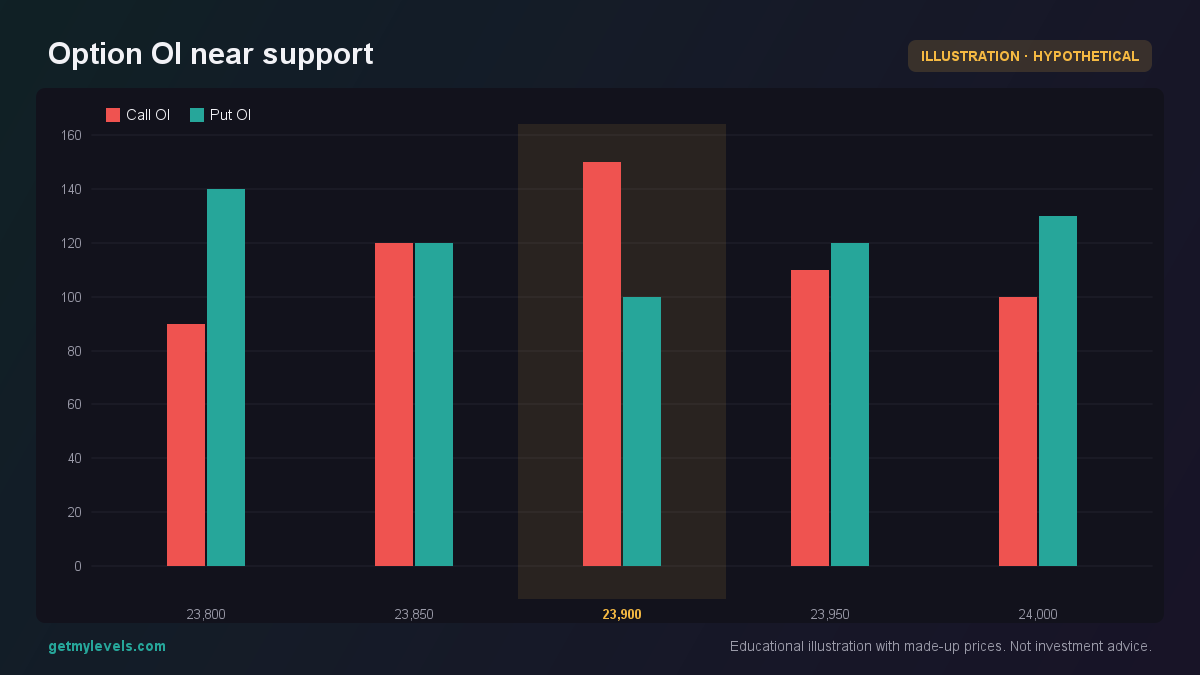 Figure 1: Higher call OI at the strike nearest the support reinforces bullish bias.
Common mistakes
- Relying on a single ΔΔ spike – A one-off spike can happen at any level. Look for a series of positive ΔΔ as price stays near the zone.
- Ignoring the broader structure – If the price is already in a downtrend, a ΔΔ spike at a support may not be enough to suggest a reversal. Confirm with the overall trend and other indicators.
- Misinterpreting negative ΔΔ – A negative spike near a resistance can be a sign of sellers stepping in, but it may also simply be a temporary pullback. Don’t jump to conclusions without additional context.
How it fits with support and resistance zones
ΔΔ is most useful when combined with the institutional support and resistance zones that GetMyLevels displays. These zones are built from the entire price history and show where large market participants have previously stepped in.
The figure below shows a price path with a support zone, a resistance zone, and a ΔΔ spike at the support. The ΔΔ spike at the support zone is a clear signal that buyers are entering as price touches that level.
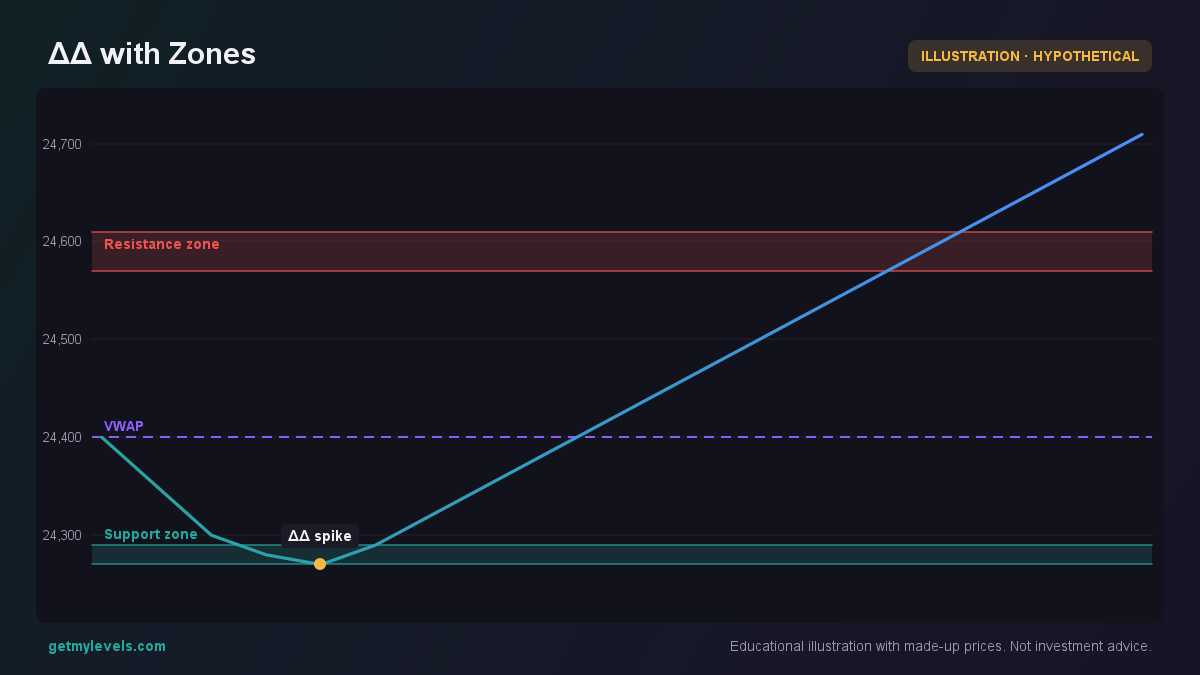 Figure 2: ΔΔ rises at the support zone, reinforcing the potential reversal.
Notice how the ΔΔ spike aligns with the support zone. If the price stays above the zone after the spike, it can signal that the support is holding. If it breaks below, the spike may have been a false signal.
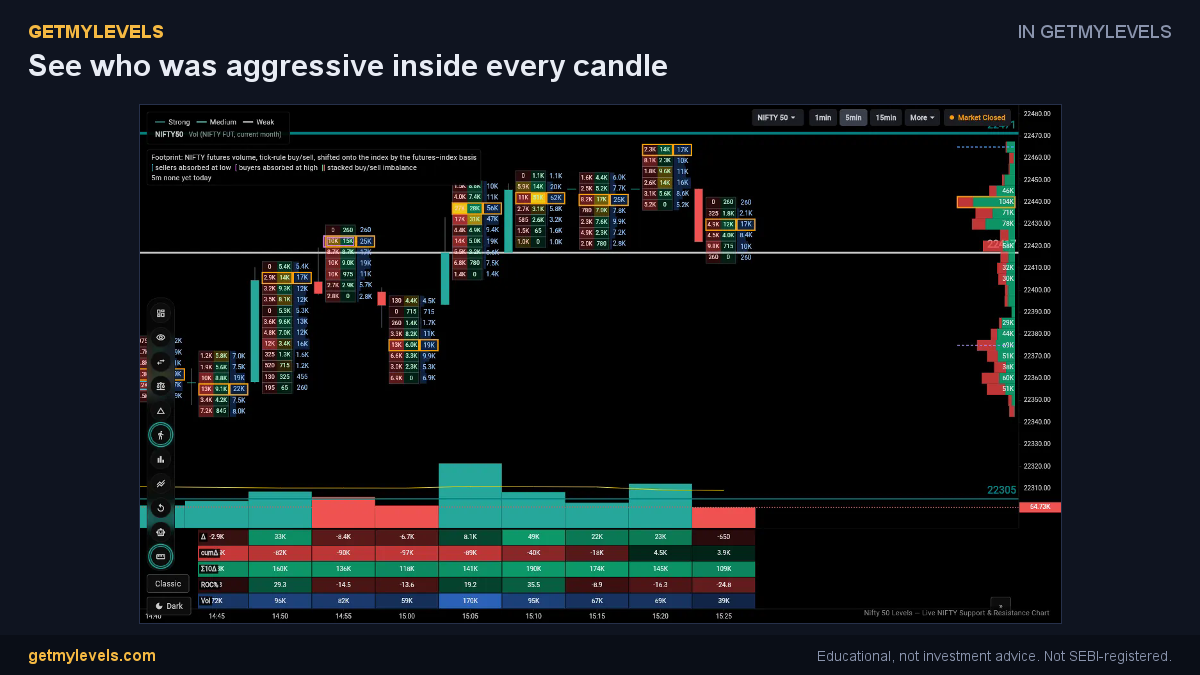 In GetMyLevels: See who was aggressive inside every candle. The live chart draws this for NIFTY, BANK NIFTY and SENSEX.
Summary
- ΔΔ is the difference between buying and selling volume; a high positive ΔΔ signals buyer interest.
- Look for ΔΔ spikes as price approaches a support zone; they often precede a bounce back.
- Combine ΔΔ with the live support and resistance levels on GetMyLevels for stronger confirmation.
- Avoid over-reacting to a single spike; confirm with overall trend and additional data.
- Use the example numbers as a guide; real-time charts on GetMyLevels will show you the actual levels and ΔΔ values for the current market.
The support zones you see in the figures are the same live levels available on GetMyLevels, which refreshes in real time and includes order-flow data, option-chain OI, and bar replay. This makes it easier to spot the same ΔΔ patterns and support interactions in your own trading sessions.
Written by an AI agent from GetMyLevels level data and checked by automated compliance rules. Educational, not investment advice. Not SEBI-registered.