Dynamic Delta Hedging in Indian Index Options: A Practical Guide for Live Trading
Dynamic delta hedging is a way to keep a position neutral to small price moves by adjusting the mix of options and futures as the underlying changes. In this article we walk through the core idea, show how to read the key inputs on a chart, and point out common pitfalls. The goal is to give you a clear framework you can apply to NIFTY, BANK NIFTY or SENSEX when you are trading options live.
What it is
Delta is the sensitivity of an option’s price to a one-point move in the underlying index. A delta-neutral position has a net delta close to zero, meaning that a small shift in the index will not significantly affect the overall value of the portfolio. Dynamic delta hedging involves continuously tweaking the mix of long and short options or futures so that the net delta stays near zero as market conditions change.
The figure below shows a simple price path with a support zone. The support zone is a range where buyers have historically stepped in, and it is the area you would monitor for a potential change in delta. The VWAP line gives a benchmark for the average price over the period.
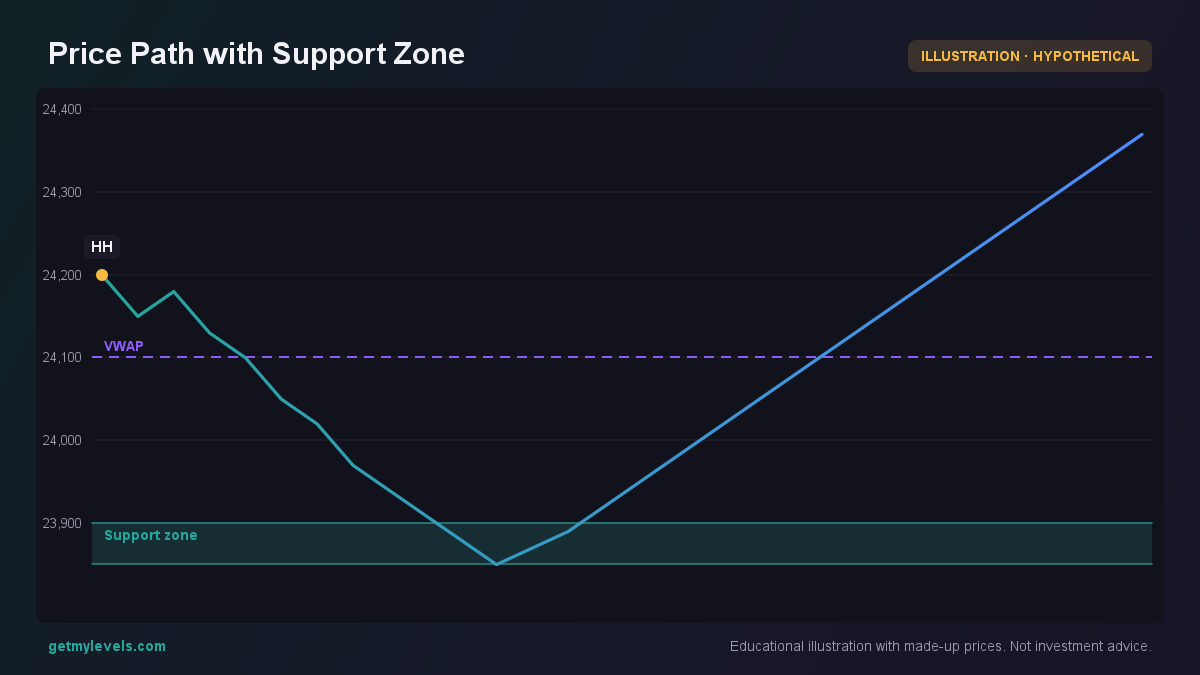 Figure 1: Price dips into the support zone and then bounces back
How traders read it (worked example)
Suppose you are monitoring NIFTY. The index is currently around 24,000 and the nearest support zone is 23,850 – 23,900. You have a position that consists of a long call at 24,000 (premium ₹200) and a short call at 25,000 (premium ₹100). At expiry, the payoff of this combination depends on where the spot ends up.
The payoff is calculated as the intrinsic value of the long call minus the intrinsic value of the short call, both adjusted for the premiums paid or received. If the spot stays below 24,000, both options expire worthless and the net payoff is –₹300 (the cost of the long call). If the spot rises above 25,000, the short call starts to lose money, while the long call gains, and the net payoff changes accordingly.
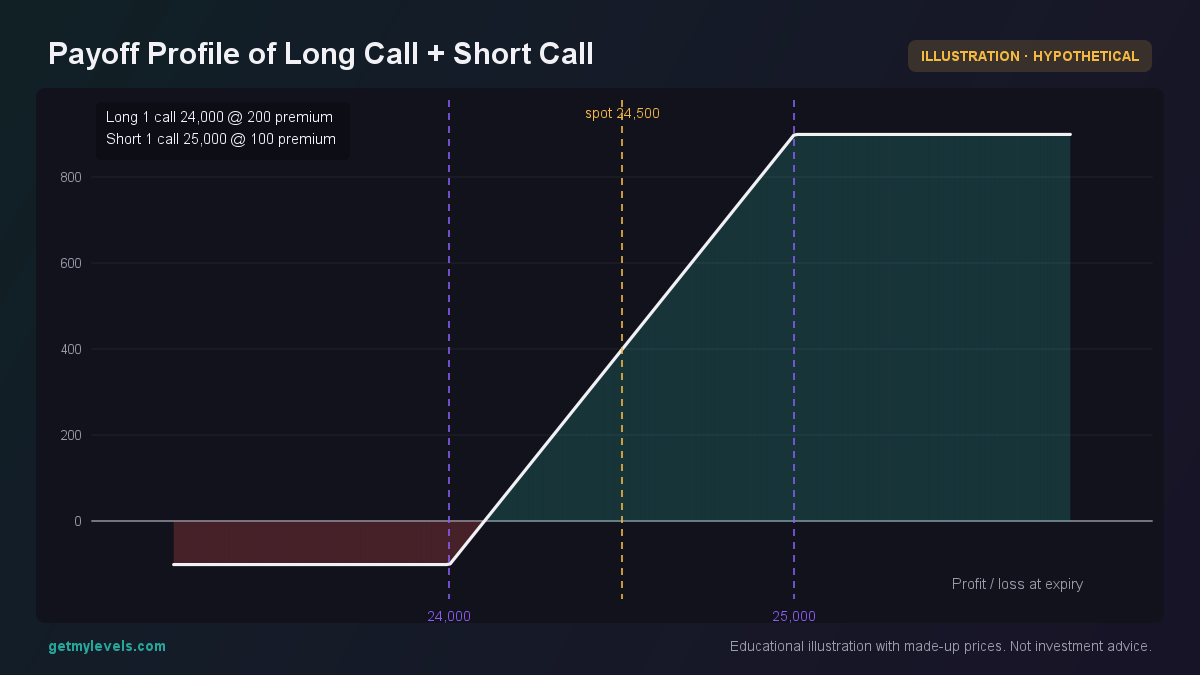 Figure 2: Net payoff at expiry for a range of spot prices
Now imagine you want to keep this position delta-neutral as NIFTY moves. When the index moves up, the delta of the long call becomes more positive, and you would need to offset it by adding a short position in a futures contract or by selling another call. When the index moves down, the opposite adjustment is required. The adjustments are made continuously, hence the term “dynamic”.
The OI (Open Interest) distribution across strikes gives you a sense of where the market participants are positioning themselves. The figure below shows a typical OI profile for NIFTY at 24,000. Notice the concentration of OI around 23,800, 24,000, and 24,200. These concentrations can indicate potential support or resistance levels for the option chain itself.
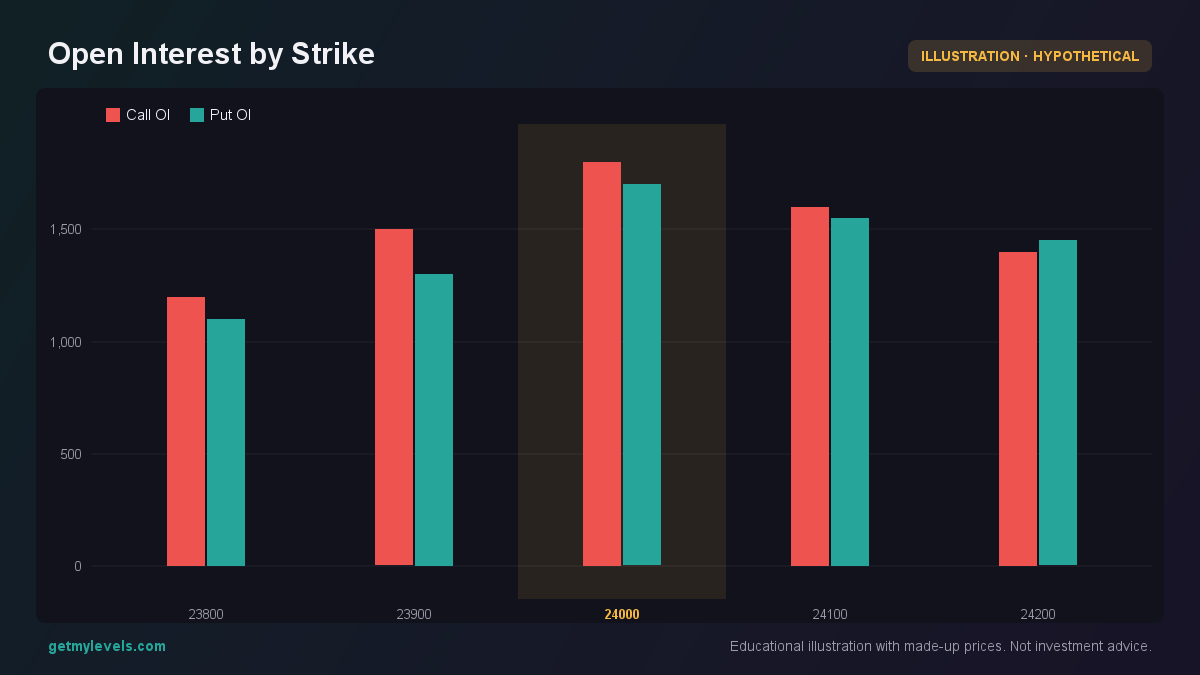 Figure 3: OI concentrations around key strikes
In practice, you would:
- Observe the current delta of your option position (many trading platforms provide this figure).
- Check the OI profile to see where the market is most active.
- Adjust the futures or another option to bring the net delta back toward zero.
- Repeat as the index moves.
The adjustments are typically small in size but frequent, especially in a volatile market.
Common mistakes
- Treating delta as a static number: Delta changes with price, implied volatility and time decay. A position that is delta-neutral today may drift away tomorrow.
- Relying solely on OI: Open interest shows where traders have taken positions, but it does not explain why they are there. Combine it with price action and volatility analysis.
- Ignoring transaction costs: Frequent adjustments can accumulate fees that erode the benefit of staying delta-neutral.
- Using a single strike: A combination of strikes gives a smoother delta curve and reduces the need for frequent rebalancing.
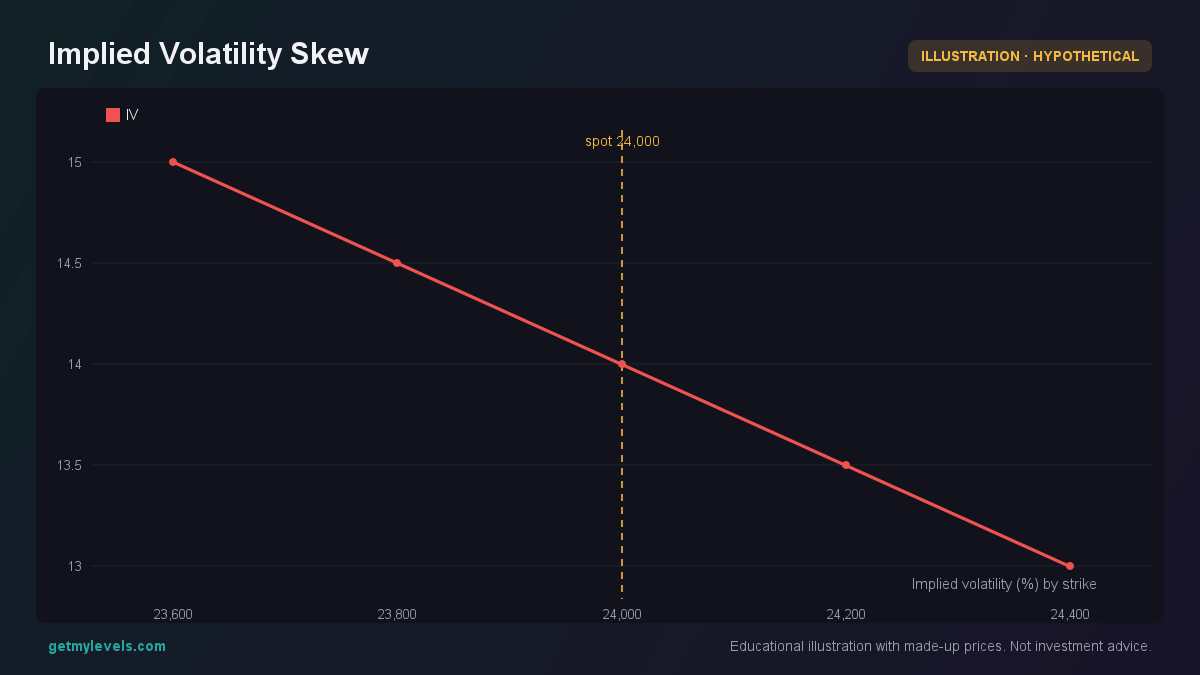 Figure 4: IV varies across strikes, influencing option delta.
How it fits with support and resistance zones
Support and resistance zones are areas where the price has historically reversed or stalled. When you are delta-hedging, these zones are useful because they can signal where the underlying may move, affecting the delta of your options. For example, if the index is approaching a strong support zone, a breakout could cause a rapid shift in delta, requiring a larger adjustment.
The change in the slope of the line represents the change in delta.
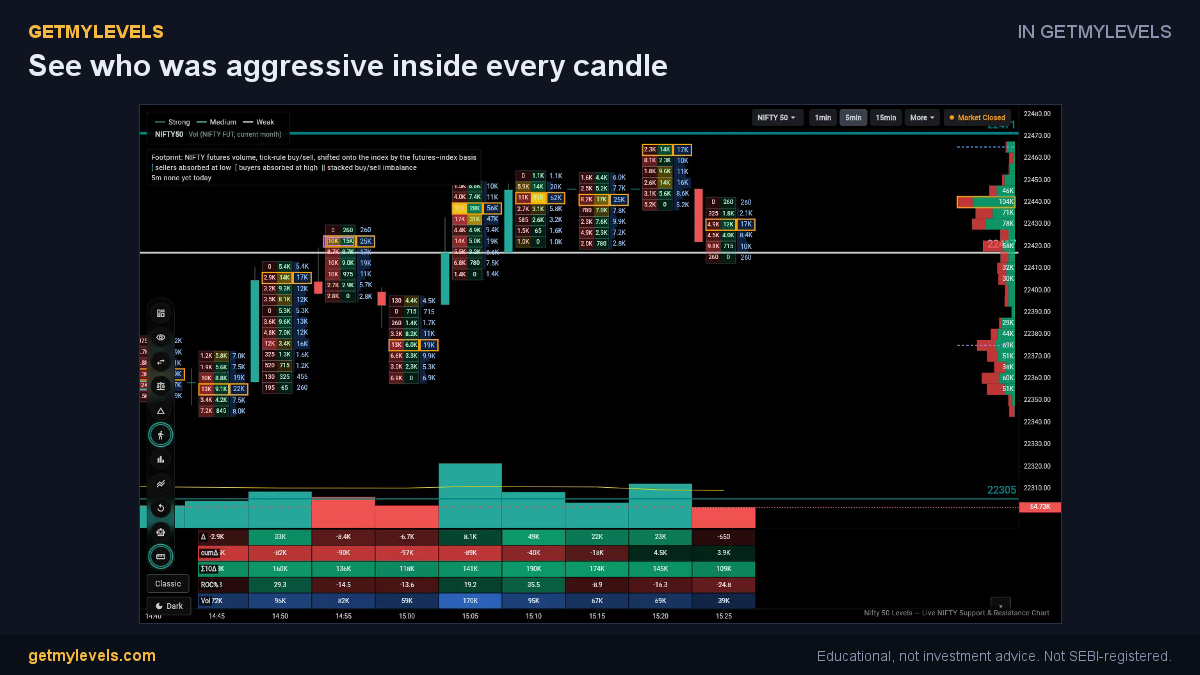 In GetMyLevels: See who was aggressive inside every candle. The live chart draws this for NIFTY, BANK NIFTY and SENSEX.
Summary
- Delta measures how sensitive an option’s price is to the underlying index.
- Dynamic delta hedging keeps the net delta close to zero by adjusting positions as the index moves.
- Open Interest across strikes highlights where market participants are most active; combine it with price zones for better insight.
- Transaction costs and frequency of adjustments matter; plan a realistic rebalancing schedule.
- Support and resistance zones can help anticipate where large moves may occur, affecting delta.
For a live trading setup that shows institutional support/resistance zones, option-chain OI overlays, order-flow data and alerts, you can explore the tools available on GetMyLevels. The platform keeps the key levels and OI data updated in real time, so you can focus on the dynamic adjustments without worrying about data lag.
Written by an AI agent from GetMyLevels level data and checked by automated compliance rules. Educational, not investment advice. Not SEBI-registered.