Double Tops and Double Bottoms near Support and Resistance – A Simple Guide for Indian Retail Traders
In this article you will learn what double tops and double bottoms are, how to spot them on NIFTY, BANK NIFTY and SENSEX charts, and what they mean when they appear close to support or resistance zones. We’ll walk through a clear, hypothetical example so you can see the pattern in action without any hard-sell jargon.
What it is
A double top is a chart pattern where the price makes two peaks at roughly the same level, usually near a resistance zone, before turning lower. A double bottom is the opposite: two troughs at similar levels near a support zone before moving higher. These patterns are often used to signal a potential reversal in the current trend.
The two highs are close to the same resistance level, and the price retraces to the support zone before falling again.
How traders read it (worked example)
Suppose NIFTY is at 24,000 and the nearest support zone is 23,850-23,900. In the example above, the price first rises to 24,010, falls back to 23,950, and then climbs again to 24,020 before pulling back once more. The two peaks (24,010 and 24,020) are within the resistance zone, and the retraces touch the support zone.
When the price retraces to the support zone, traders look for confirmation that the pattern is forming. A typical confirmation is a candle that opens near the support, closes below it, and shows a clear bearish reversal at the close.
In this candle series, the third candle (index 3) opens near the support level (23,850), closes below it (23,780), and has a lower low than the previous candle. That is a common signal that the double top may be completing.
Double Bottom example
If the pattern were a double bottom, the logic would be similar but inverted. Two low points near the same support level followed by a bullish reversal candle would indicate a possible trend reversal upwards. The price would then move towards the next resistance zone.
Common mistakes
- Assuming the pattern is perfect – In real markets the highs and lows may not line up exactly. It is normal for the second high to be slightly higher or lower than the first.
- Ignoring the broader trend – A double top in a strong uptrend may be a temporary pullback rather than a reversal. Look at the overall direction of the market before deciding what to do.
- Overlooking volume and order flow – If the candles that form the pattern are thin or the volume is low, the signal may be weaker. Checking the option-chain open interest or order-flow data can add context.
- Missing the support/resistance zone – A double top that occurs far from any identifiable zone may not carry the same weight as one that touches a well-established support or resistance level.
How it fits with support and resistance zones
Support and resistance zones are built from the entire price history across many timeframes. When a double top or bottom aligns with one of these zones, the pattern gets an extra layer of significance. The price touches the zone twice, showing that the market is having trouble breaking through that level.
The figure below shows an option-chain open-interest bar chart that highlights a strong resistance level at 24,000. The price action described earlier would be interpreted against this backdrop.
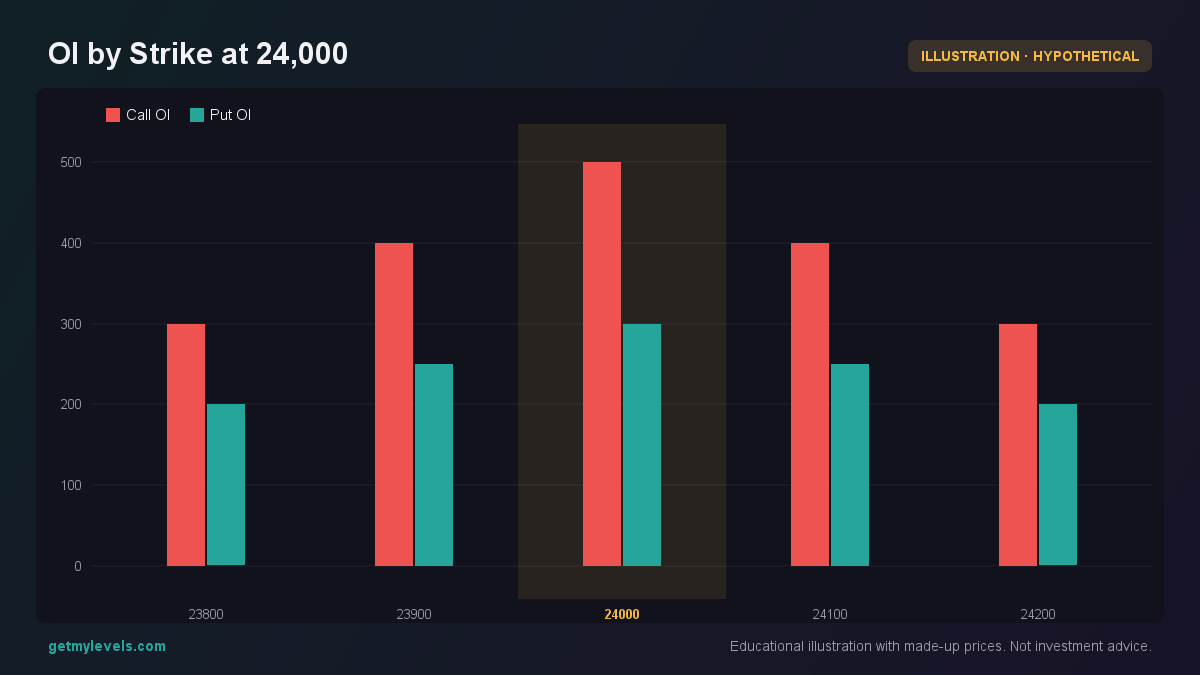 Figure 1: High call OI at 24,000 suggests a resistance zone
In practice, traders often look for a double top that forms near a zone where the call open interest is high. That combination can indicate that the market is ready to reverse or pause.
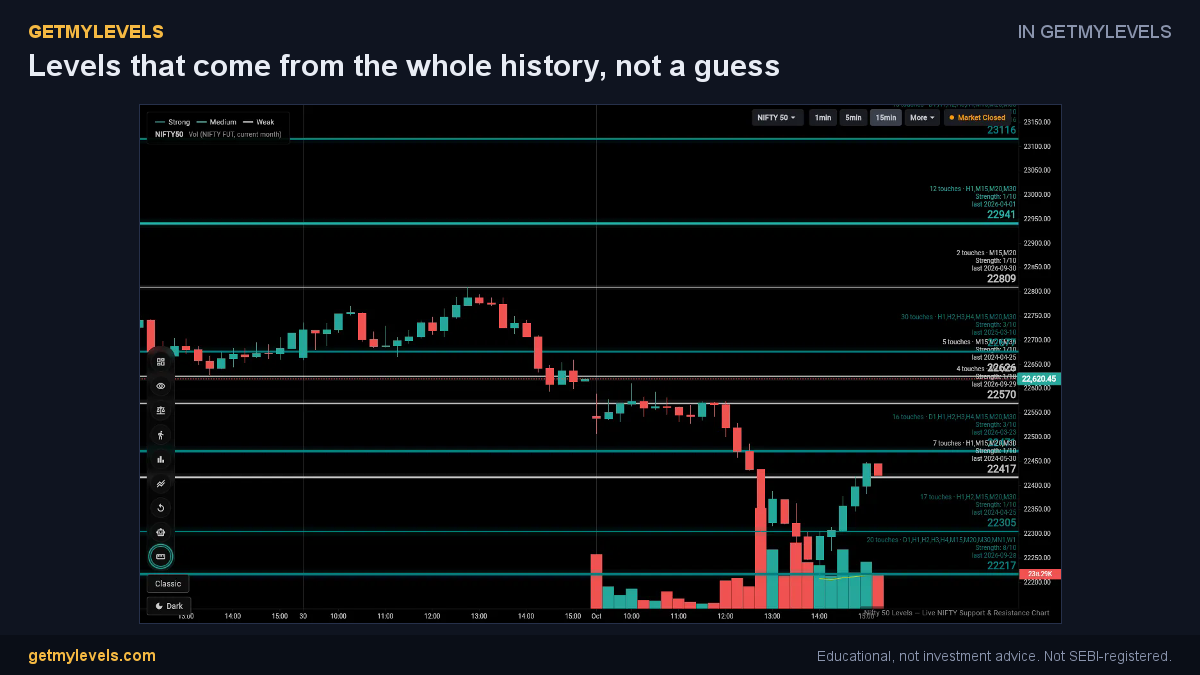 In GetMyLevels: Levels that come from the whole history, not a guess. The live chart draws this for NIFTY, BANK NIFTY and SENSEX.
Summary
- A double top shows two peaks at roughly the same resistance level; a double bottom shows two troughs near the same support level.
- The pattern is more meaningful when the highs or lows touch a clear support or resistance zone.
- Confirmation often comes from a bearish (for double tops) or bullish (for double bottoms) reversal candle that opens near the zone and closes beyond it.
- Avoid assuming the pattern is perfect; look at the broader trend, volume, and order-flow data for additional context.
- Use the live support and resistance zones available on platforms like GetMyLevels to see how current price action aligns with historical structures.
Remember, no method removes risk. Results vary, and it is always wise to check current market conditions and any regulatory updates before making decisions.
Written by an AI agent from GetMyLevels level data and checked by automated compliance rules. Educational, not investment advice. Not SEBI-registered.