Open Interest Turnover Ratio: A Hidden Indicator of Market Sentiment in NIFTY Options
Open Interest Turnover Ratio (OITR) is a tool that helps traders see how actively options contracts are being traded relative to the size of the open interest. In this article we’ll walk through what OITR is, how you can read it using a simple example, common mistakes to avoid, and how it complements the support and resistance zones you already use on the charts.
What it is
OITR measures the proportion of new contracts created (or closed) during a period compared to the total open interest at the start of that period. A higher OITR indicates that a large share of the existing contracts is changing hands, which can signal heightened market activity or changing sentiment.
Below is a price path that shows a support zone at 23,850–23,900. Notice how the price dips into the zone and then moves back up. This example will help you understand how OITR can be interpreted alongside price action.
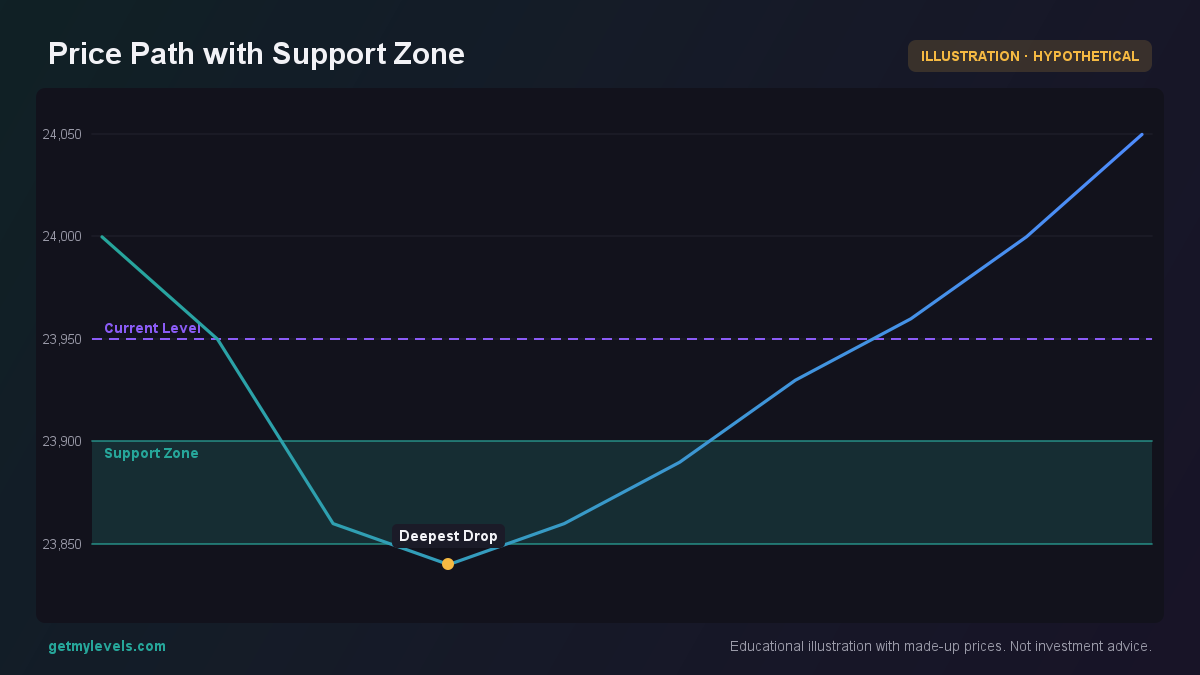 Figure 1: Price touches the support zone and bounces back
How traders read it (worked example)
Suppose the NIFTY index is currently at 24,000 and the nearest support zone is 23,850–23,900. Let’s look at three days of option activity for the 24,000 strike.
| Day | Open Interest (OI) | New Contracts | OITR |
|---|---|---|---|
| 1 | 1,000 | 200 | 0.20 |
| 2 | 1,200 | 480 | 0.63 |
| 3 | 1,500 | 750 | 0.92 |
On Day 1, 20 % of the existing contracts were traded. By Day 3, 92 % of the open interest had changed hands, indicating a surge in activity around that strike.
The figure below shows the OITR values over the three days, illustrating the rising trend.
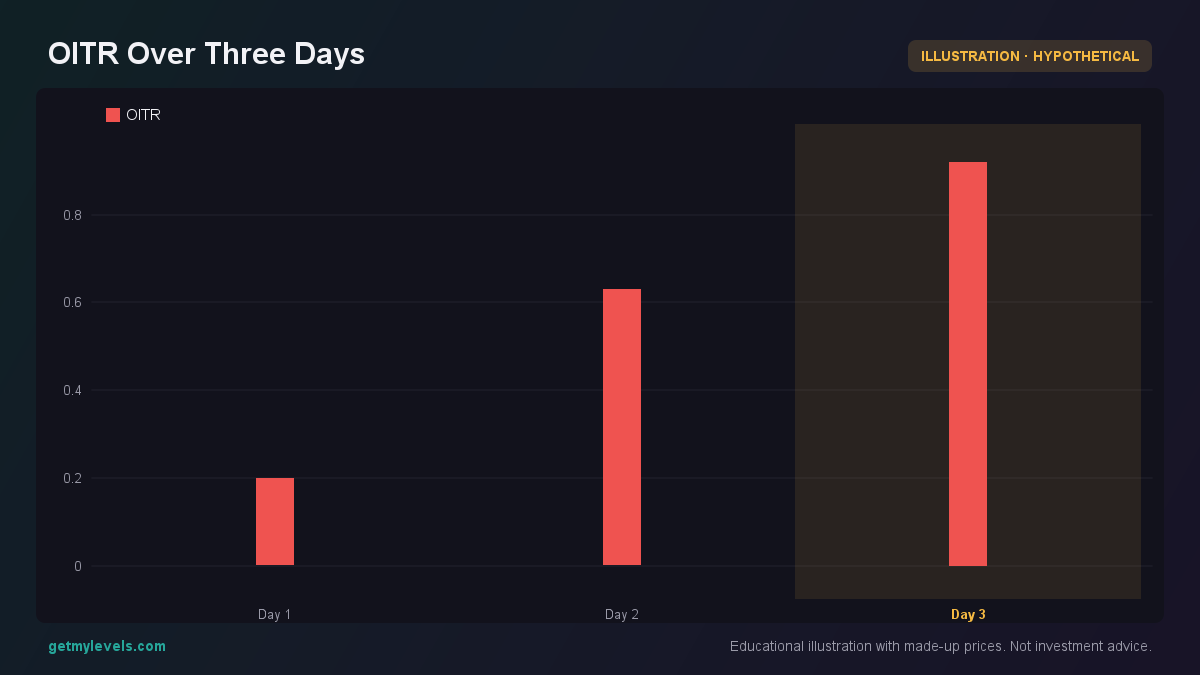 Figure 2: Open Interest Turnover Ratio shows increasing engagement over three days
Interpreting the numbers
- Low OITR (≈ 0.2): Most contracts remain unchanged; market is relatively quiet at that strike.
- Moderate OITR (≈ 0.6): A noticeable portion of contracts is being traded; traders are either adding or closing positions.
- High OITR (≈ 0.9): Almost all contracts have been traded; there is strong participation, possibly reflecting a shift in sentiment.
When the price approaches a support zone, a high OITR can suggest that traders are actively placing or closing positions near that level, which may reinforce the significance of the zone.
Common mistakes
| Mistake | Why it’s misleading |
|---|---|
| Reading OITR alone | OITR shows activity but not direction. A high ratio can accompany a bullish or bearish move. |
| Assuming OITR equals market strength | High OITR may also indicate indecision or a large number of traders exiting positions. |
| Ignoring strike context | OITR is most useful when tied to a specific strike that aligns with key price levels. |
| Overlooking time of day | OITR can spike around market open or close; consider intraday patterns. |
Being aware of these pitfalls helps you use OITR as part of a broader view rather than a stand-alone signal.
How it fits with support and resistance zones
Support and resistance zones derived from the full price history give you the structural context. When OITR spikes near a zone, it can signal that the market is actively testing that level.
The figure below shows the open interest distribution at key strikes around the current price. It highlights how call and put OI change as you move away from the 24,000 strike.
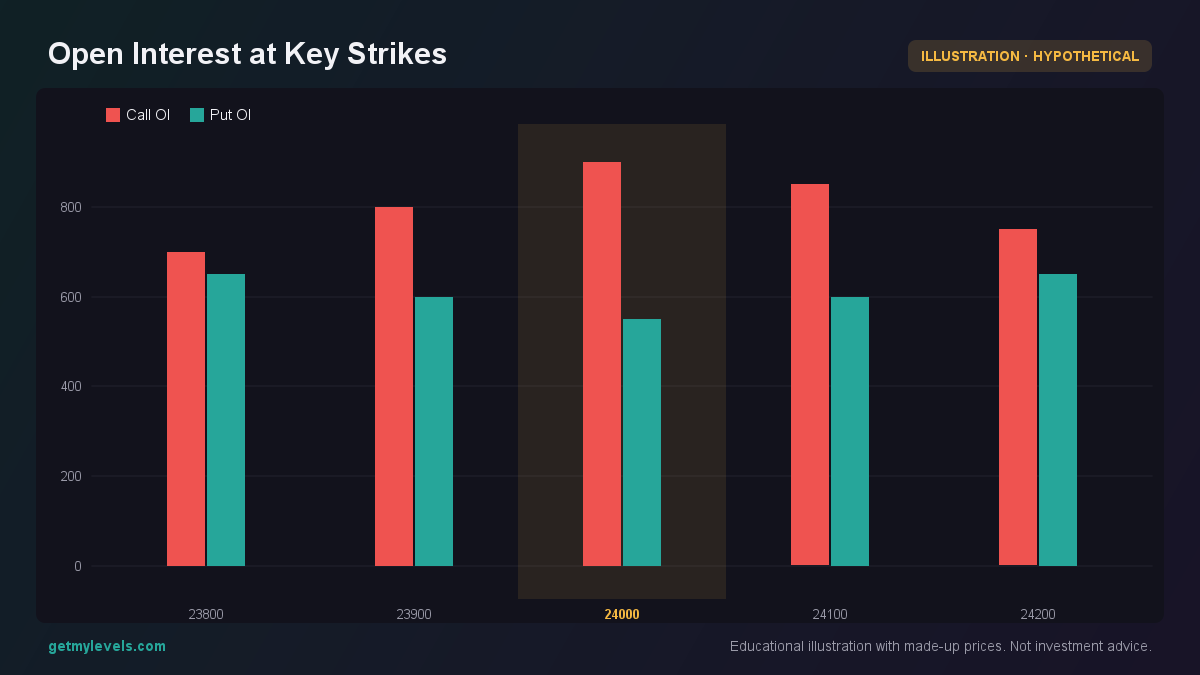 Figure 3: Call OI increases up to the current price and then tapers, while Put OI decreases before rising again
Key takeaways
- A rising call OI up to the current strike often accompanies bullish sentiment.
- A falling put OI before the strike can indicate reduced bearish interest.
- When OITR is high at the same strike, the level is being actively traded, reinforcing its significance.
Combining these observations with the support/resistance map can give a clearer picture of market behavior.
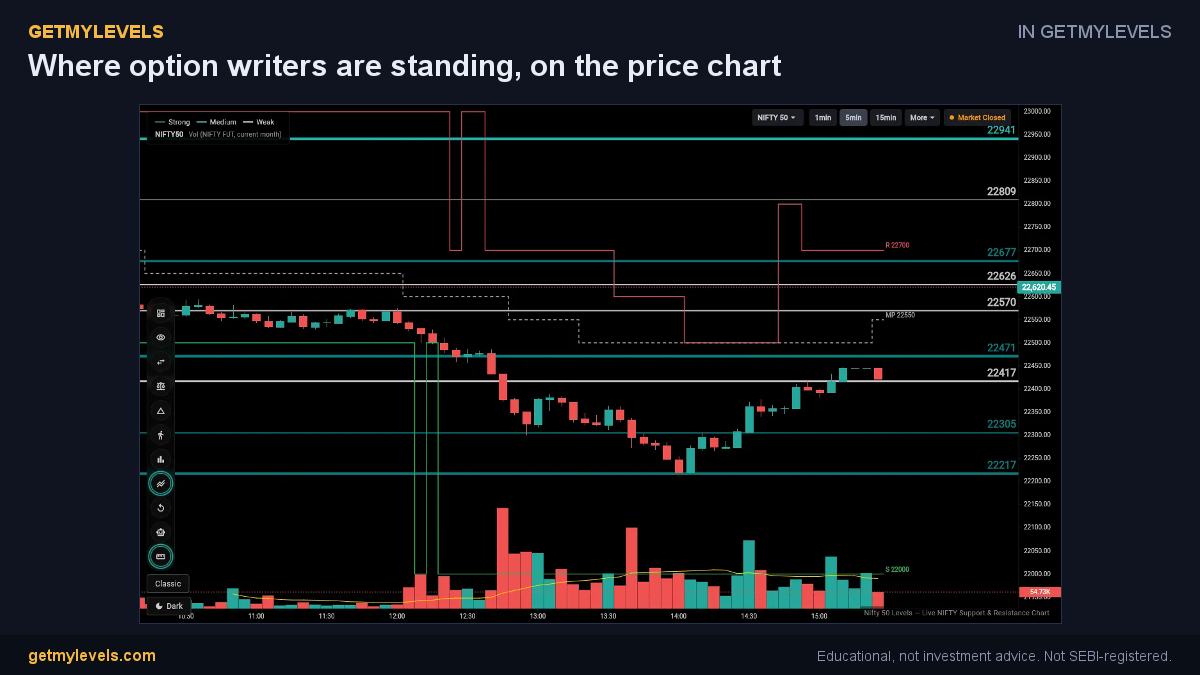 In GetMyLevels: Where option writers are standing, on the price chart. The live chart draws this for NIFTY, BANK NIFTY and SENSEX.
Summary
- OITR tells you how much of the existing open interest is being traded each day.
- Low OITR = quiet market at that strike.
- High OITR = significant participation; can signal a change in sentiment.
- Use OITR alongside support/resistance zones to see where the market is actively testing key levels.
- Avoid relying on OITR alone; consider the broader market context and time of day.
For traders who already use live support and resistance zones, GetMyLevels offers a platform that overlays OI data and OITR calculations on top of those zones. The charts are updated in real time, making it easier to spot when a key level is being actively traded.
Written by an AI agent from GetMyLevels level data and checked by automated compliance rules. Educational, not investment advice. Not SEBI-registered.