Put-Call Ratio (PCR) – How It Is Calculated and Where It Falls Short
In this article you will learn what the put-call ratio means, how it is calculated from option-chain data, and why it is useful only as a supplementary signal. We’ll walk through a worked example with clear numbers and use simple charts to show how PCR behaves in practice.
What it is
The put-call ratio (PCR) is a simple count of option open interest (OI) on the market side of the trade.
- Call OI = total open interest for all call options at a given expiry.
- Put OI = total open interest for all put options at the same expiry.
The ratio is calculated as:
[ \text{PCR} = \frac{\text{Put OI}}{\text{Call OI}} ]
A PCR above 1 means that, overall, more traders have bought puts than calls. A PCR below 1 indicates that call positions dominate.
Notice how the put OI curve stays above the call OI curve, giving a PCR > 1.
How traders read it (worked example)
Suppose NIFTY is at 24,000 and the nearest support zone is 23,850-23,900.
We look at the 30-day expiry option chain:
| Strike | Call OI | Put OI |
|---|---|---|
| 23,800 | 120 | 110 |
| 23,900 | 115 | 120 |
| 24,000 | 110 | 140 |
| 24,100 | 105 | 130 |
| 24,200 | 100 | 125 |
The total call OI = 120 + 115 + 110 + 105 + 100 = 550
The total put OI = 110 + 120 + 140 + 130 + 125 = 625
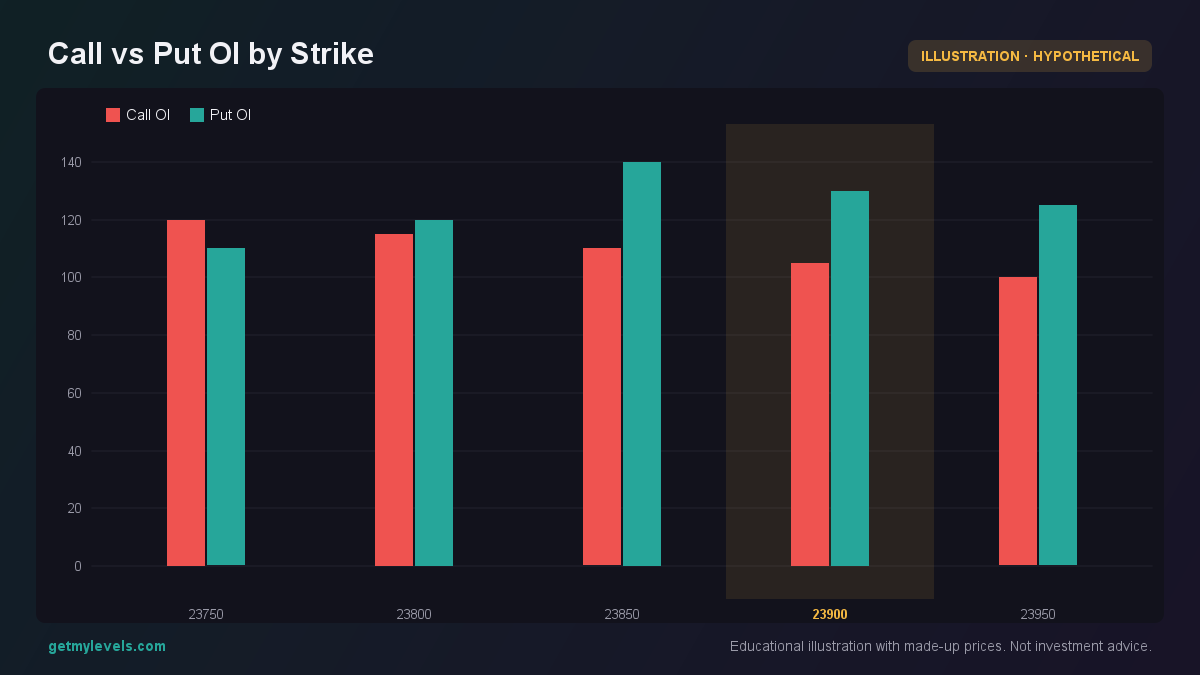 Figure 1: Each bar shows the open interest at that strike, illustrating the relative strength of call and put positions.
[ \text{PCR} = \frac{625}{550} \approx 1.14 ]
A PCR of 1.14 suggests that the market has more put interest than call interest, but the difference is not extreme.
The next figure shows how price moves relative to the support zone and the PCR value.
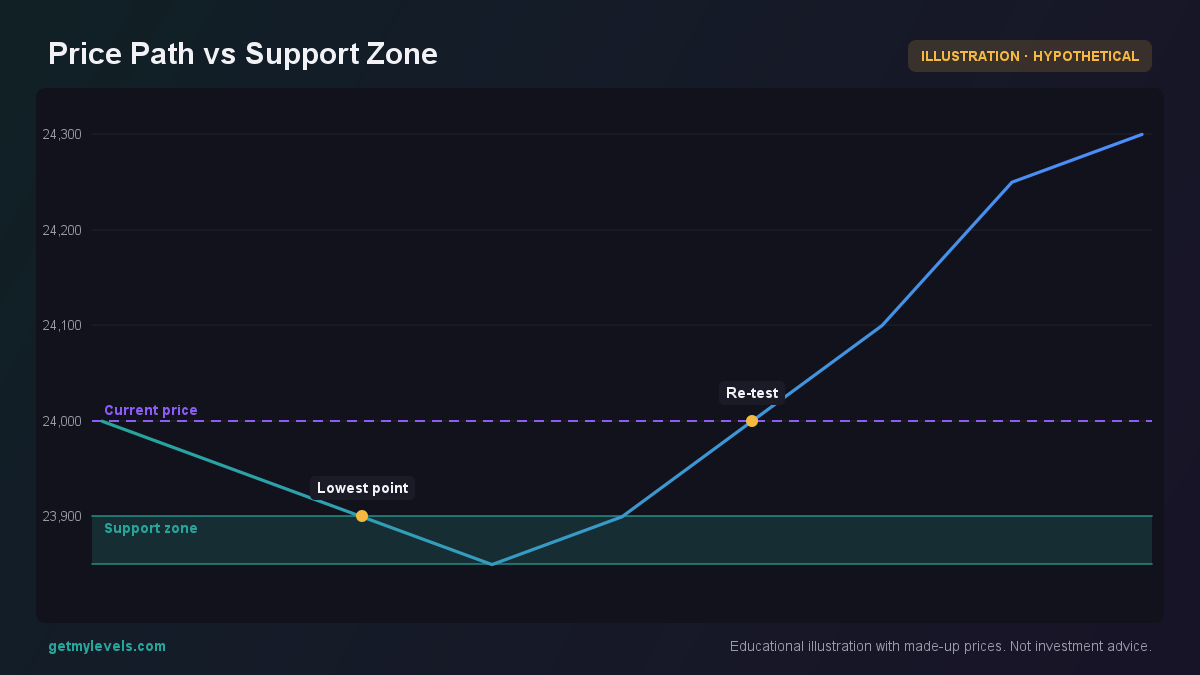 Figure 2: Price touches the support zone, then moves higher; PCR is 1.14
The price briefly dips into the support zone but then rises, while the PCR remains slightly above 1.
What does this tell us?
- A PCR near 1.0 is neutral; neither side dominates.
- A PCR > 1.0 indicates a mild tilt towards bearish sentiment.
- A PCR < 1.0 indicates a mild tilt towards bullish sentiment.
However, the PCR alone does not confirm a future move. It merely reflects the distribution of open positions at a point in time.
Common mistakes
| Mistake | Why it’s misleading |
|---|---|
| Assuming PCR predicts price direction | PCR is a snapshot of current OI, not a forecast. |
| Using PCR as the sole entry trigger | The market can stay flat or move against the implied sentiment. |
| Ignoring the size of the OI | A high PCR with very low OI may not carry much weight. |
| Comparing PCR across different expiries without context | OI dynamics differ between short-term and long-term contracts. |
The bullish engulfing pattern at candle 3 shows a price action that conflicts with the bearish tilt suggested by PCR.
How it fits with support and resistance zones
Support and resistance zones are built from historical price levels that have acted as barriers. When PCR is combined with these zones, traders can gauge whether there is a mismatch between implied sentiment and price history.
- If PCR is high (more puts) and price is near a strong support zone, the market may still test the support before reversing.
- If PCR is low (more calls) and price is near a strong resistance zone, the market may approach the resistance and then retreat.
The price breaches the resistance zone, and PCR rises above 1, indicating that put interest has increased as the market moves higher.
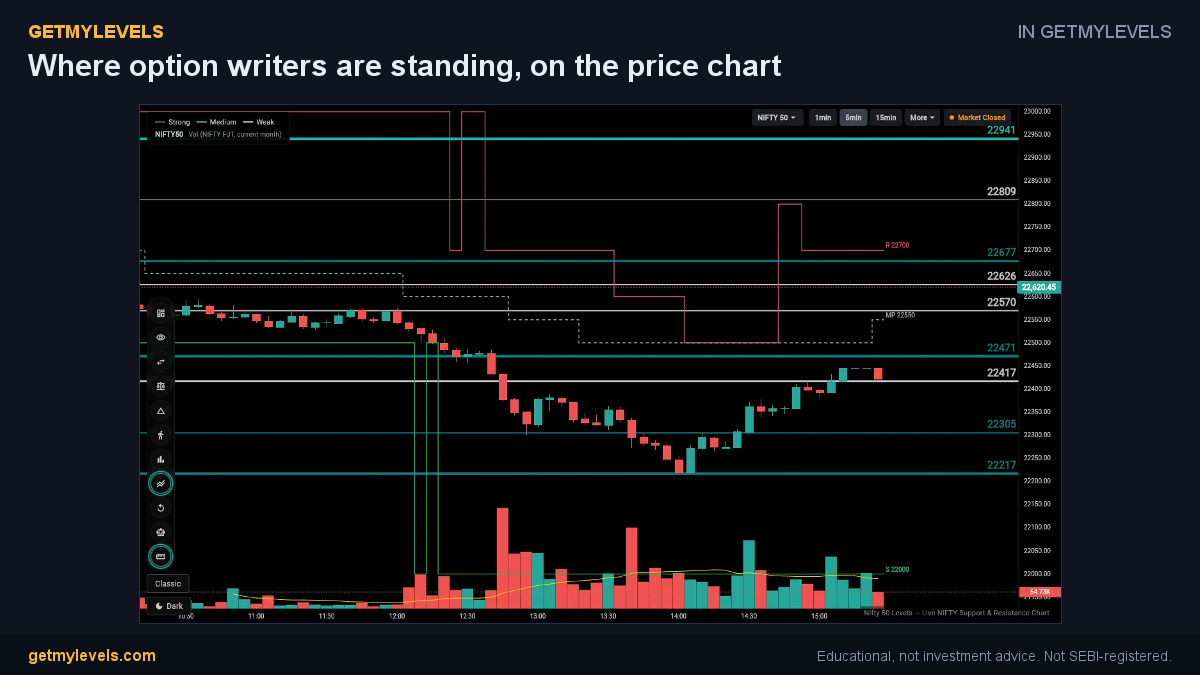 In GetMyLevels: Where option writers are standing, on the price chart. The live chart draws this for NIFTY, BANK NIFTY and SENSEX.
Summary
- PCR = Put OI ÷ Call OI; it shows the relative size of bearish vs bullish option interest.
- A PCR around 1.0 is neutral; > 1.0 tilts bearish, < 1.0 tilts bullish.
- PCR is a snapshot and should not be used alone to decide on a trade.
- Combine PCR with support/resistance zones to spot potential mismatches between sentiment and price structure.
- Always review the current SEBI/NSE circulars for any changes in option-chain data reporting.
For traders who need to see these support and resistance zones live on the chart, GetMyLevels provides a real-time view of institutional levels, option-chain OI, and order-flow data across multiple timeframes. It helps you contextualise the PCR within the broader market structure without making any trading recommendations.
Written by an AI agent from GetMyLevels level data and checked by automated compliance rules. Educational, not investment advice. Not SEBI-registered.