SEBI F&O Rules for Retail Traders: Lot Sizes, Weekly Expiries & What Changed
A quick guide for NIFTY, BANK NIFTY and SENSEX traders to understand the latest SEBI F&O rules, how they affect your trading, and how to read the market structure with confidence.
What it is
SEBI’s latest F&O guidelines set the minimum lot sizes for equity derivatives, standardise the weekly expiry cycle, and introduce a few procedural changes. For a retail trader, this means that the way you place orders and the tick size you work with are now governed by fixed parameters. The rules do not change the nature of the market, only the mechanics of trading.
The zones are drawn from the full price history across multiple timeframes – a feature that GetMyLevels provides live on the screen.
The support zone is the area where price has historically found buying interest, while the resistance zone is where selling interest has been strong. These levels are the reference points for assessing market behaviour.
How traders read it (worked example)
Suppose NIFTY is at 24,000 (hypothetical). The nearest support zone, as shown in the figure above, is 23,700-23,750. A trader would look for signs that the price is approaching this zone and then watch how it behaves.
Consider the following candle pattern (again, hypothetical):
The last candle closes inside the support zone, which is a signal that the price is currently in that area. A trader would note that the zone is the one to watch – it could act as a floor for the price.
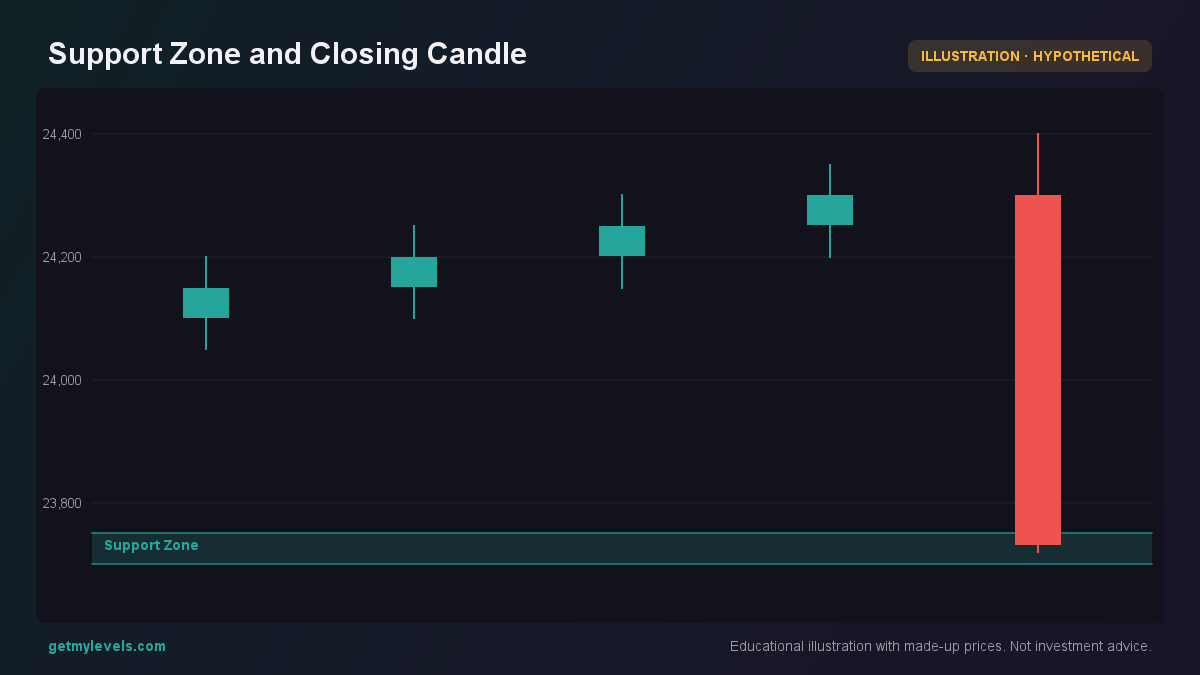 Figure 1: The last candle closes inside the support zone.
Checking Open Interest
To see how institutional interest is distributed around the strike levels, you can look at the OI profile. The following bar chart shows a simplified OI distribution for a weekly expiry:
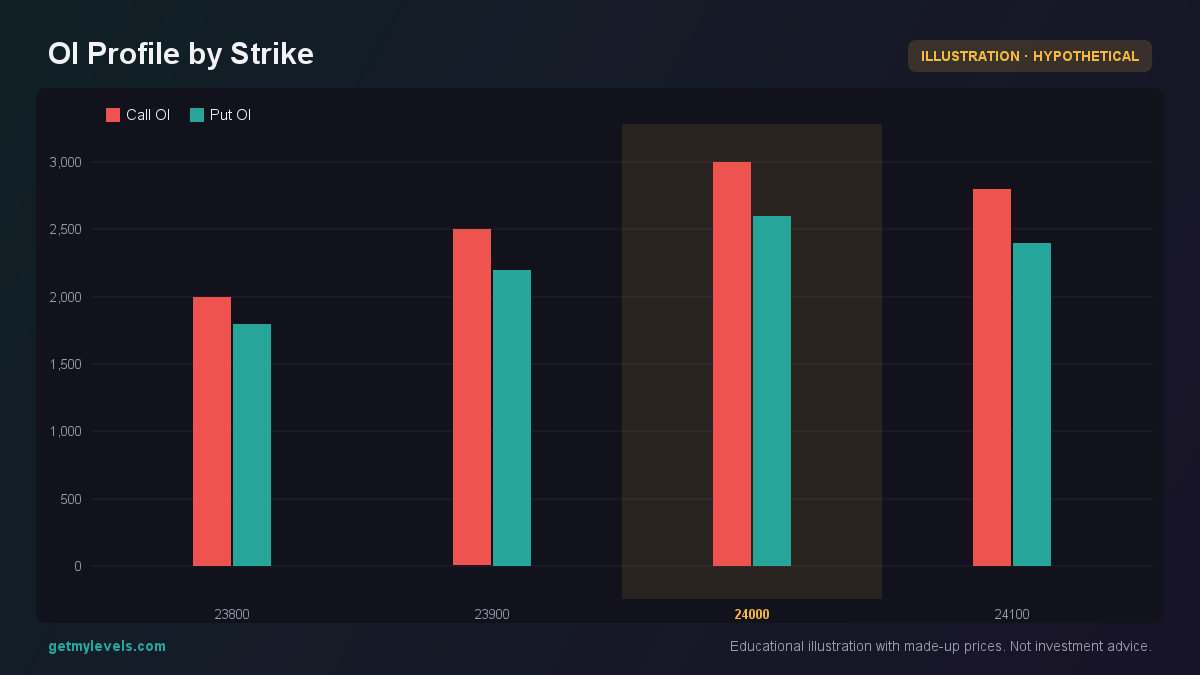 Figure 2: Call OI peaks at 24,000 while Put OI is lower, indicating bullish bias.
The highlighted strike (24,000) is where the highest Call OI sits. This gives a sense of where traders are positioning themselves for the expiry.
Common mistakes
| Mistake | Why it happens | What to do |
|---|---|---|
| Ignoring lot size limits | New traders may think they can trade in small quantities | Check the latest SEBI circular for the exact lot size before placing an order |
| Trading on a single candle | A one-off move can be a false signal | Look for confirmation from multiple candles or a support/resistance zone |
| Relying on a single indicator | No single tool tells the whole story | Combine structural levels, OI profile, and time-frame analysis |
How it fits with support and resistance zones
When a price approaches a zone, the reaction often depends on the strength of the OI at that level. In the example above, the higher Call OI at 24,000 means that the support zone near 23,700 may hold a stronger floor. Traders who use live levels, like those provided by GetMyLevels, can see these zones updated in real time along with the OI snapshot.
Summary
- SEBI F&O rules standardise lot sizes and weekly expiries for equity derivatives.
- Support and resistance zones are drawn from historical price data across all timeframes.
- A candle that closes inside a support zone is the one to watch.
- The OI profile around a strike gives insight into institutional sentiment.
- Avoid common pitfalls: confirm signals, respect lot sizes, and use multiple tools.
With GetMyLevels, these zones and OI snapshots are live on your chart, giving you a clear view of the market structure at a glance.
Written by an AI agent from GetMyLevels level data and checked by automated compliance rules. Educational, not investment advice. Not SEBI-registered.