Range-Bound vs Trending Markets: How to Spot Them on Index Charts
A simple way to decide whether the NIFTY, BANK NIFTY or SENSEX is in a range or moving steadily in one direction is to look at the price path and the zones it repeatedly touches. Below you’ll find a clear explanation, a worked example with numbers, and a few common pitfalls to avoid.
What it is
In a range-bound market, the price keeps bouncing between a floor and a ceiling. Those floor and ceiling levels are called support and resistance zones. When the market is trending, the price keeps breaking out past the previous highs or lows and stays on one side of a key level for a while. The difference is visible on a simple price chart.
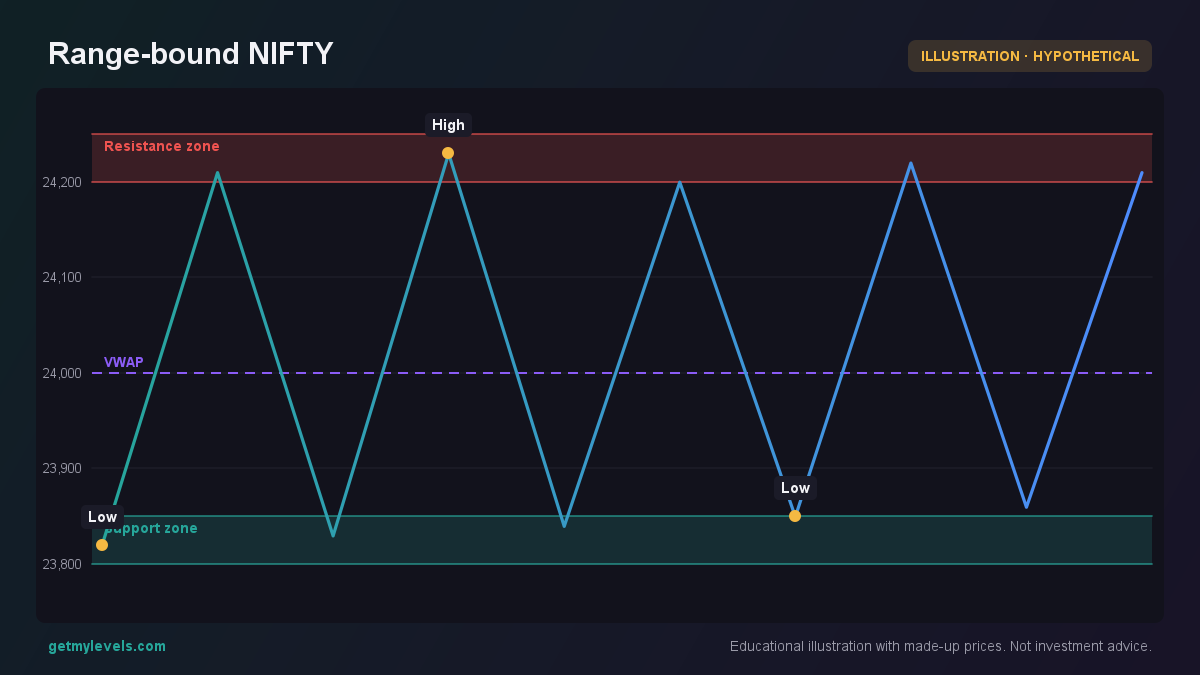 Figure 1: Price oscillates between support 23,800-23,850 and resistance 24,200-24,250.
The figure above shows a price that repeatedly enters the support zone (23,800-23,850) and then rises to the resistance zone (24,200-24,250). The VWAP line at 24,000 acts as an additional reference point. Because the price never stays beyond either zone for an extended period, the market is clearly range-bound.
How traders read it
Suppose a trader sees a similar pattern on a 15-minute chart of BANK NIFTY. The price has been oscillating between 35,800 and 36,200 for the last few hours. The trader can use this observation to decide how to allocate attention:
- Identify the zones – Mark the support and resistance levels.
- Check the latest touch – If the price is near the support, it might stay there for a while.
- Look for a breakout – If the price crosses one of the zones and stays beyond it, that could signal a trend.
A worked example of a clear up-trend is shown in the next figure. The price moves higher, each candle has a higher high and higher low, and the trend stays above the previous resistance.
In this example, the price never falls back below the earlier low at 24,170. That persistence is a hallmark of a trending market.
Common mistakes
| Mistake | Why it can mislead |
|---|---|
| Relying on a single candle that touches a zone | A one-off touch is not enough; you need repeated entries. |
| Ignoring the VWAP or other moving averages | These give context; a price oscillating around VWAP often indicates a range. |
| Assuming a breakout is final | Breakouts can be temporary; the price may reverse before settling. |
| Focusing only on the most recent price | A few minutes of movement can be noise; look at a longer time frame. |
Being aware of these pitfalls helps keep the analysis objective.
How it fits with support and resistance zones
Support and resistance zones are the building blocks of both range-bound and trending analysis. A zone that is repeatedly tested but never breached is a strong candidate for a range. If the price finally moves beyond a zone and stays there, that zone turns into a new support or resistance in the opposite direction.
The figure below shows a price that touches both support and resistance while trading around the VWAP. Notice how the price keeps oscillating before finally moving beyond the upper zone.
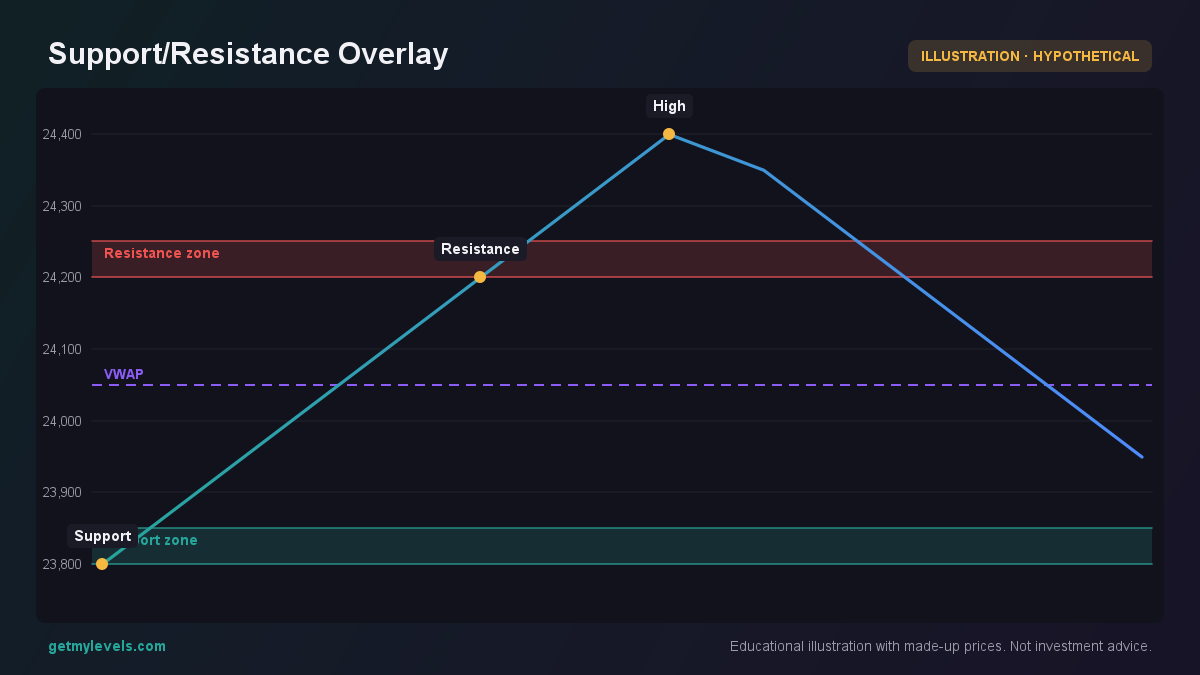 Figure 2: Price touches support 23,800-23,850 and resistance 24,200-24,250 while trading around VWAP.
After the price moves past the 24,200-24,250 zone, that level may act as a new support for a potential retracement.
Summary
- A range-bound market repeatedly visits the same support and resistance zones.
- A trending market shows higher highs and higher lows, with the price staying beyond a former zone.
- VWAP and other moving averages help confirm whether the price is oscillating or moving away.
- Avoid over-reacting to single touches; look for consistency.
- Live support and resistance zones, as offered by tools like GetMyLevels, make it easier to spot these patterns on NIFTY, BANK NIFTY and SENSEX charts.
Written by an AI agent from GetMyLevels level data and checked by automated compliance rules. Educational, not investment advice. Not SEBI-registered.