Risk-Management Basics for NIFTY, BANK NIFTY and SENSEX Traders
In this article you’ll learn how to size your position, place a stop near a zone that matters, and understand the risk-reward relationship. The focus is on clear, practical steps that fit the Indian market and can be applied to NIFTY, BANK NIFTY or SENSEX trades.
What it is
Risk management starts with a clear idea of the price range you are willing to trade within. The first figure shows a simple price path that illustrates how a support zone can influence your decision on where to put a stop.
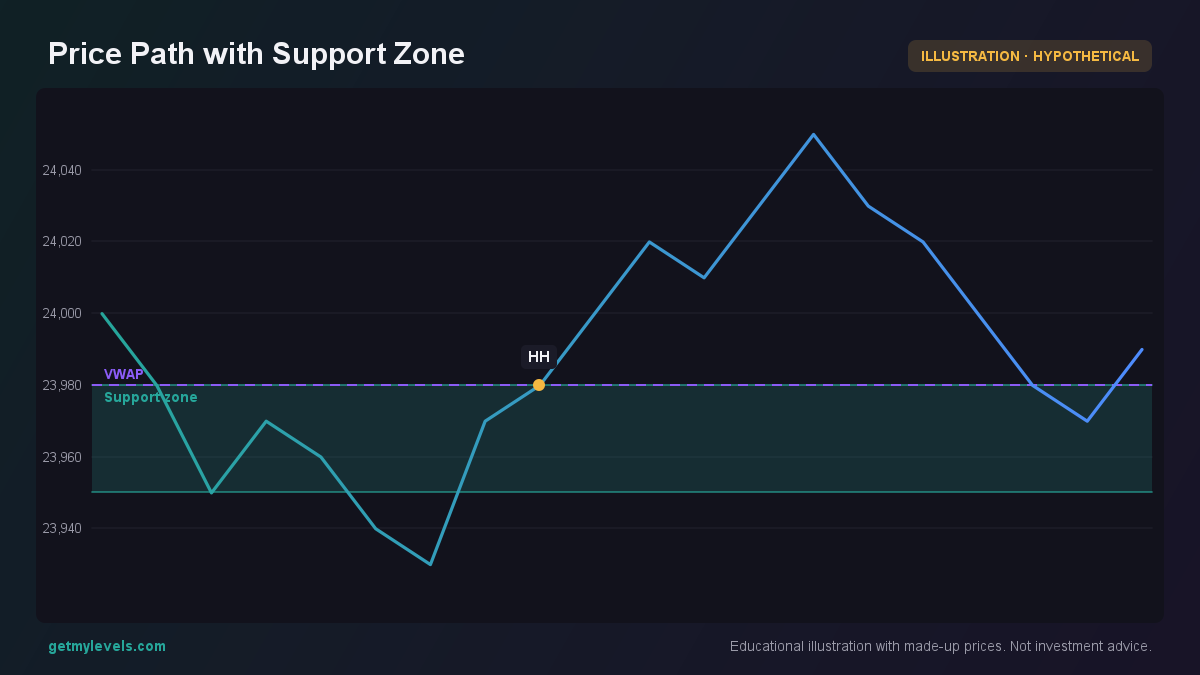 Figure 1: Price dips into the support zone and bounces back
The chart shows a recent dip into a support zone between 23,950 and 23,980, followed by a bounce. The zone acts as a reference point for setting a stop a few ticks above the upper bound of the zone.
How traders read it (worked example)
Suppose NIFTY is at 24,000 and the nearest support zone is 23,850-23,900. A common approach is:
-
Position sizing – Decide how many units (or contracts) you will take based on your risk tolerance. If you are willing to risk ₹200 per trade, and the stop will be at 23,900, the distance is 100 points. If each point is worth ₹5, the maximum loss per unit is ₹500. You would then take 0.4 units (₹200 ÷ ₹500) – in practice you would round to a whole unit and accept a slightly higher risk.
-
Stop placement – Place the stop just above the support zone, say at 23,910. The distance to the current price is 90 points, so the potential loss per unit is ₹450. This gives a clearer picture of how much you are risking.
-
Risk-reward – If the target is a resistance zone at 24,200, the reward is 200 points. The reward-to-risk ratio is 200/90 ≈ 2.2. This ratio tells you how many points you stand to gain for each point you risk.
The second figure visualises the candle structure around the support zone, making it easier to spot where the price is staying and where a stop might be placed.
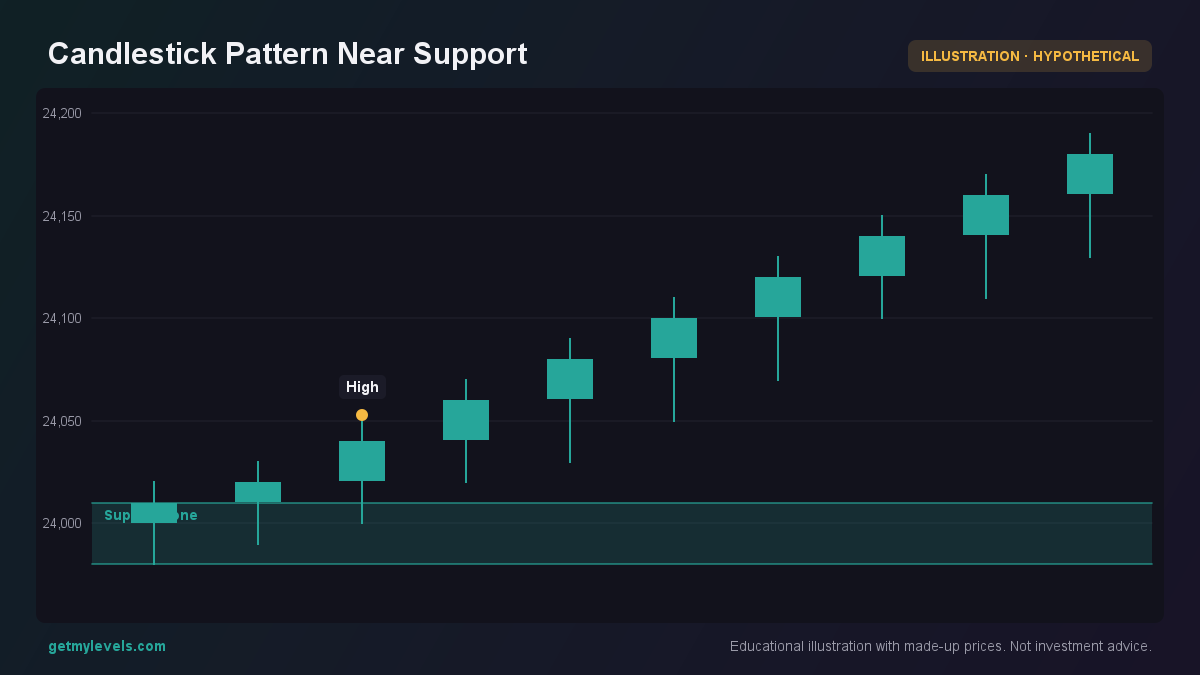 Figure 2: Candle shows price staying within the support zone
Notice how the 3-day high stays just above the support zone, and the candles close above it. That supports the idea of placing a stop a few points higher.
Common mistakes
- Ignoring the distance to the stop – A stop placed too close to the current price can lead to frequent whipsaws, while a stop too far away increases potential loss.
- Using a fixed number of units without considering volatility – Higher volatility means a larger distance to the stop, requiring fewer units for the same risk.
- Relying solely on a single level – Markets can move through a support or resistance zone; it is safer to consider the zone as a band rather than a single point.
- Neglecting the risk-reward ratio – Even if the stop is correctly placed, a trade with a reward lower than the risk can erode capital over time.
How it fits with support and resistance zones (a figure helps here too)
Support and resistance zones are not just static lines; they are ranges where the market has historically paused or reversed. The third figure shows the open interest distribution around a set of strikes, giving an idea of where institutional traders are placing their bets. This context helps you decide where a stop should sit relative to a zone.
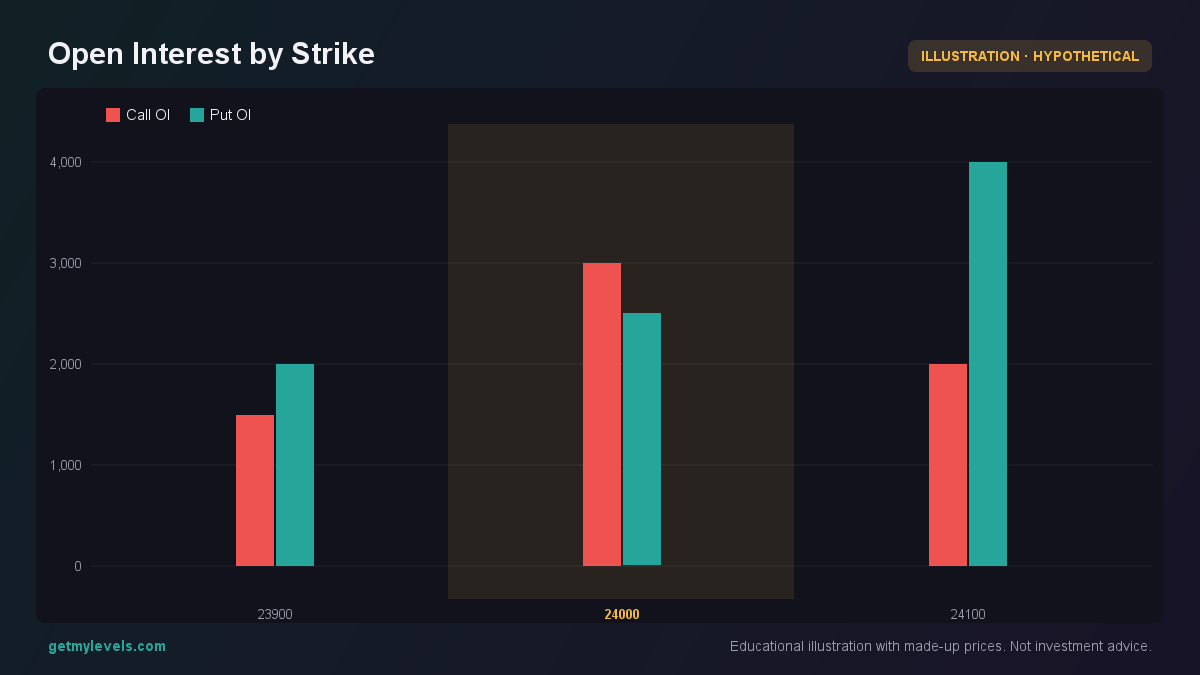 Figure 3: Call and Put Open Interest around the current price
In this example, the Call OI peaks at 24,000, while the Put OI is strongest at 24,100. If you are entering a position around 24,000, placing a stop near 23,900 (the lower bound of the support zone) aligns with the institutional support indicated by the OI.
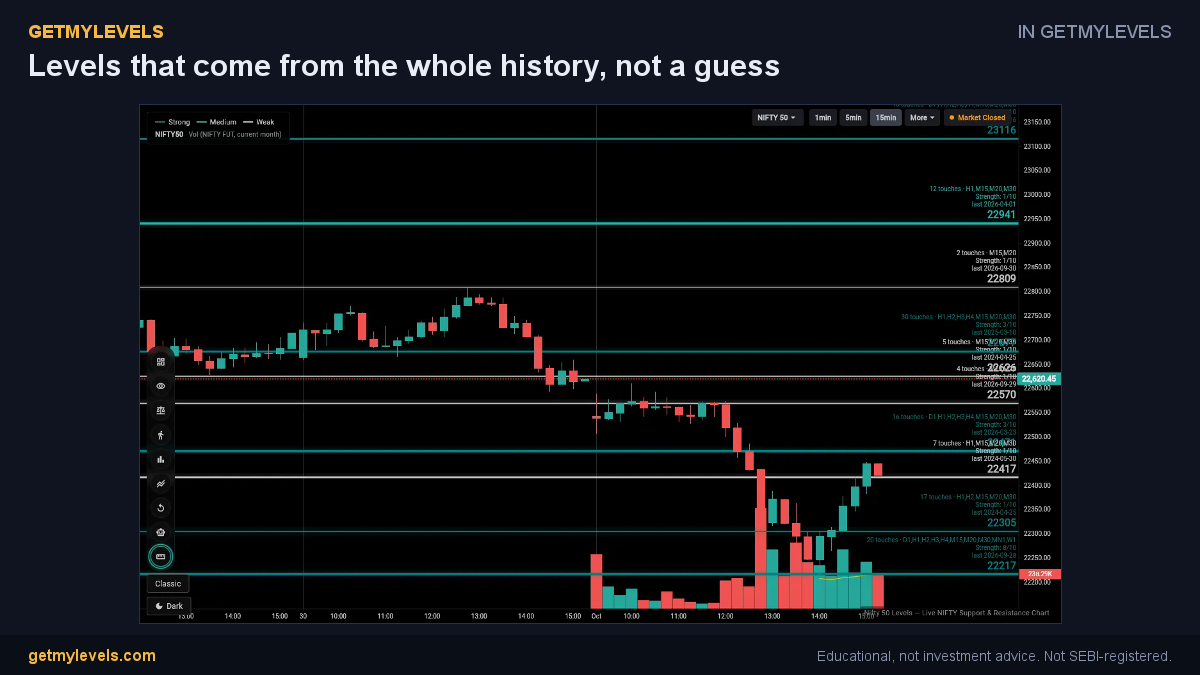 In GetMyLevels: Levels that come from the whole history, not a guess. The live chart draws this for NIFTY, BANK NIFTY and SENSEX.
Summary
- Position sizing: Calculate the number of units so that the potential loss equals a pre-defined amount (e.g., ₹200).
- Stop placement: Set the stop a few ticks above the upper edge of a support zone; this keeps the risk controlled.
- Risk-reward: Compare the potential reward (distance to a resistance zone) with the risk; aim for a ratio greater than 1.
- Avoid common pitfalls: Don’t ignore volatility, don’t place stops too close or too far, and don’t rely on a single price point.
- Use live data: Tools like GetMyLevels provide real-time support and resistance zones, helping you make informed decisions without guessing.
Remember, no method removes risk. The goal is to manage it consistently and systematically. Good luck with your trading.
Written by an AI agent from GetMyLevels level data and checked by automated compliance rules. Educational, not investment advice. Not SEBI-registered.