How Open-Interest Concentration Helps Spot Pinning in NIFTY Options
Getting a feel for where the market might pin its price at expiry can give you a clearer picture of the balance between buyers and sellers. One way to see that balance is by looking at the concentration of open interest (OI) at key strike levels. In this article we explain the concept, walk through a simple example, point out common pitfalls, and show how this data fits with the support and resistance zones you already see on a chart.
What it is
Open interest is the total number of contracts that have not been settled. When a large number of contracts pile up at a particular strike, that strike becomes a concentration point. Traders often watch these points because they can act like invisible support or resistance: if the price stays near that strike until expiry, the market may “pin” there.
The figure below is a simple price path over a few days. The blue line shows the NIFTY index moving through a clear support zone between 23,850 and 23,900. The OI bar chart shows a heavy concentration at the 23,900 strike.
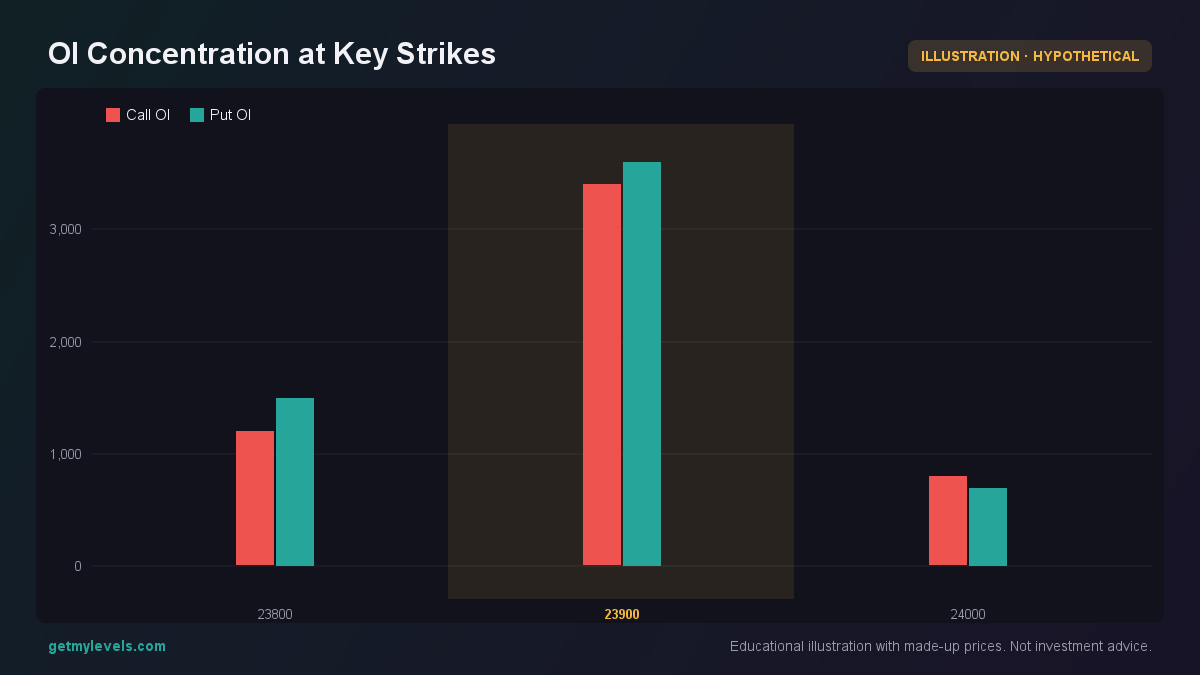 Figure 1: Notice the heavy OI pile-up at 23,900
In this example the market has a lot of contracts at 23,900. If the price stays close to that level, it can be an indicator that buyers and sellers are leaning that way.
How traders read it – a worked example
Suppose NIFTY is at 24,000 today. You look at the live chart and see:
- A support zone from 23,850 to 23,900 (labelled Support zone).
- OI concentration at 23,900: Call OI 3,400, Put OI 3,600.
- The previous close was 23,950, and the current VWAP is 23,970.
Step 1 – Identify the concentration
The bar chart shows a clear spike at 23,900. That means many traders have positions that expire around that strike. In a normal day, the market would need to move significantly away from this level for the OI to be absorbed.
Step 2 – Watch the price movement
Over the next few days the price moves as follows:
- Day 1: 24,000 → 23,920
- Day 2: 23,920 → 23,860
- Day 3: 23,860 → 23,900
- Day 4: 23,900 → 23,910
The figure below shows the price path and the support zone. The price touches the zone, dips slightly, then climbs back toward it.
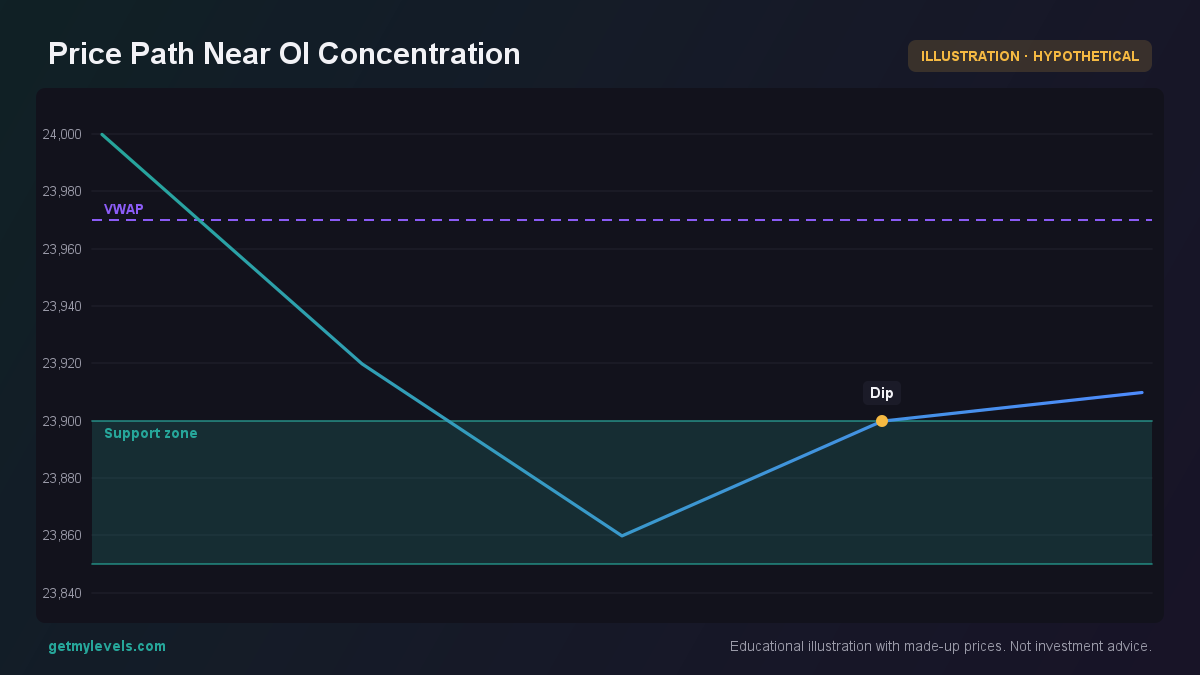 Figure 2: Price touches the support zone and then returns
Step 3 – Anticipate pinning
If the price keeps circling around 23,900 and does not break through to a new level, the heavy OI at that strike may keep pulling it back. In such a scenario, you can expect the price to “pin” near 23,900 at expiry, meaning it will be close to that strike when the options settle.
Step 4 – Verify with the payoff
A quick payoff sketch shows that at expiry, a call at 23,900 and a put at 23,900 will both have little intrinsic value if the price stays near 23,900. The figure below illustrates this.
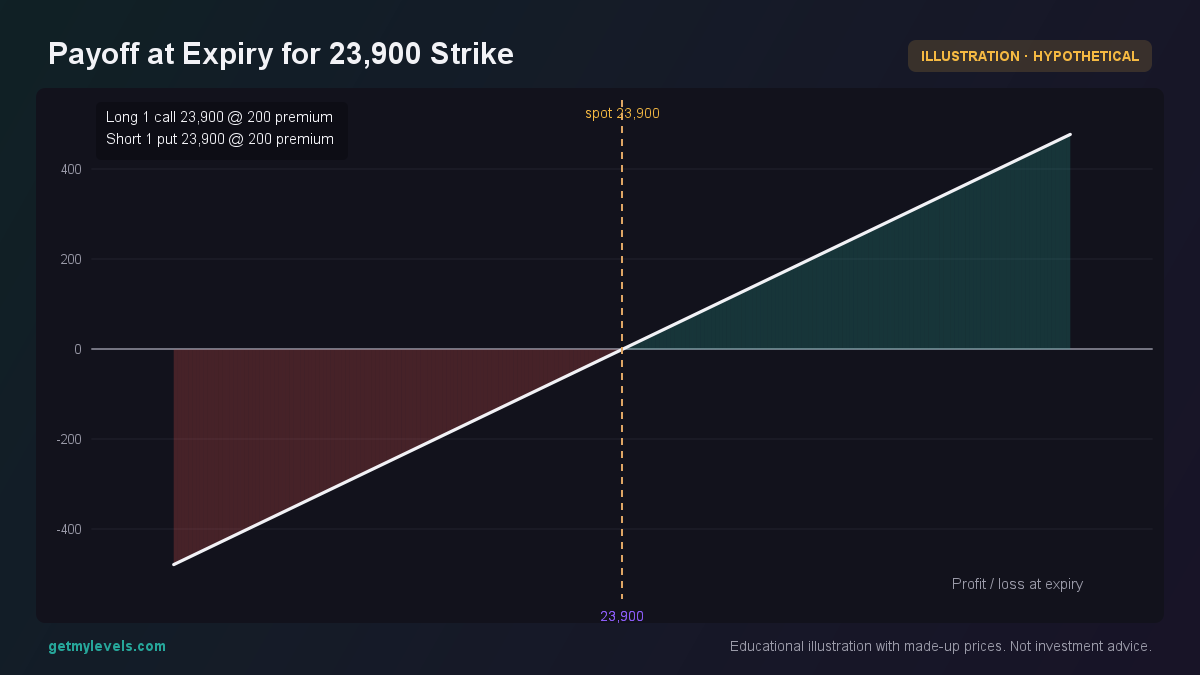 Figure 3: Both legs are near break-even if price is at 23,900
The payoff is flat because the intrinsic value is zero; the contracts have no real profit or loss if the price is exactly at the strike. That flatness is a hallmark of pinning.
Common mistakes
| Mistake | Why it matters | How to avoid it |
|---|---|---|
| Assuming OI concentration always forces a price to stay | OI can be a strong influence, but other factors like news or macro events can push the price past the concentration. | Combine OI data with support/resistance zones and market sentiment. |
| Reading OI without context | A spike at a strike could be a result of a single large position or a cluster of smaller ones. | Look at the overall trend of OI across strikes, not just one point. |
| Ignoring the time of day | OI concentration is most telling near expiry, but early in the session the market may still be forming. | Focus on the OI picture in the last few hours before expiry. |
| Using the same logic for all indices | NIFTY, BANK NIFTY, and SENSEX have different liquidity and volatility patterns. | Test the approach on each index separately before applying it broadly. |
How it fits with support and resistance zones
Support and resistance zones are built from the price’s own history across multiple timeframes. Open-interest concentration adds a layer that shows where traders’ positions are clustered. When a zone and a concentration overlap, the probability of pinning increases.
When the price hovers near a zone that also has a heavy OI concentration, the market is more likely to stay close to that level until expiry. Traders can use this information to time their exits or to set up a watchlist for that strike.
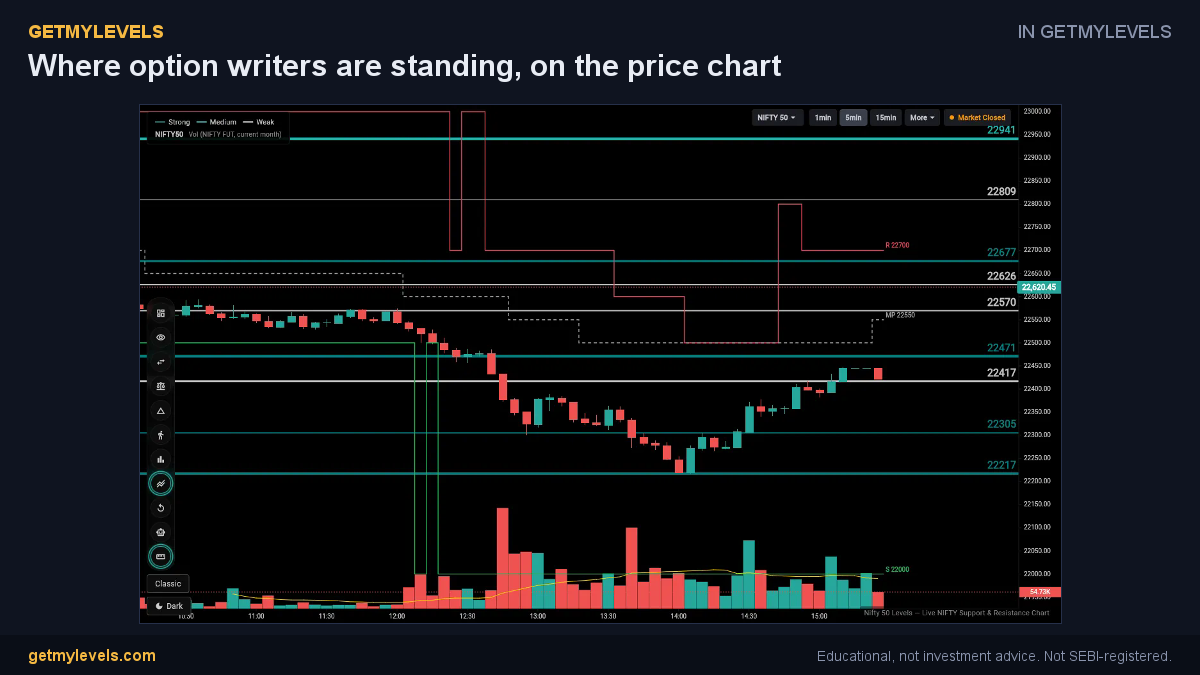 In GetMyLevels: Where option writers are standing, on the price chart. The live chart draws this for NIFTY, BANK NIFTY and SENSEX.
Summary
- Open interest concentration shows where many options contracts are clustered.
- A heavy OI pile-up at a strike can act like a hidden support or resistance.
- Pinning occurs when price stays close to that strike until expiry, often visible near a support zone.
- Combine OI data with support/resistance zones and market context for better insight.
- Remember that no method removes risk; results vary and market conditions can change.
If you want to see these levels live on a chart, the GetMyLevels platform shows institutional support/resistance zones, OI concentration, and other tools in one place. It can help you keep track of where the market is likely to pin without making any trading decisions for you.
Written by an AI agent from GetMyLevels level data and checked by automated compliance rules. Educational, not investment advice. Not SEBI-registered.