Support and Resistance Zones vs Lines: Why Zones Work Better on Index Charts
A calm, practical look at how support and resistance zones give a clearer picture of price behavior on NIFTY, BANK NIFTY, and SENSEX charts. We’ll walk through a simple example, show you the visual differences between zones and lines, and point out common pitfalls traders face.
What it is
Support and resistance zones are price bands that represent areas where buying or selling pressure has historically been strong. Unlike a single price line, a zone gives a range – it reflects that market participants consider a range of prices as “fair” rather than a precise point.
The figure below shows a hypothetical price path for NIFTY, with a support zone between 23,850 and 23,900, a resistance zone between 24,000 and 24,050, and a VWAP at 23,950. Notice how the price touches the support zone, bounces back, and later approaches the resistance zone before reversing.
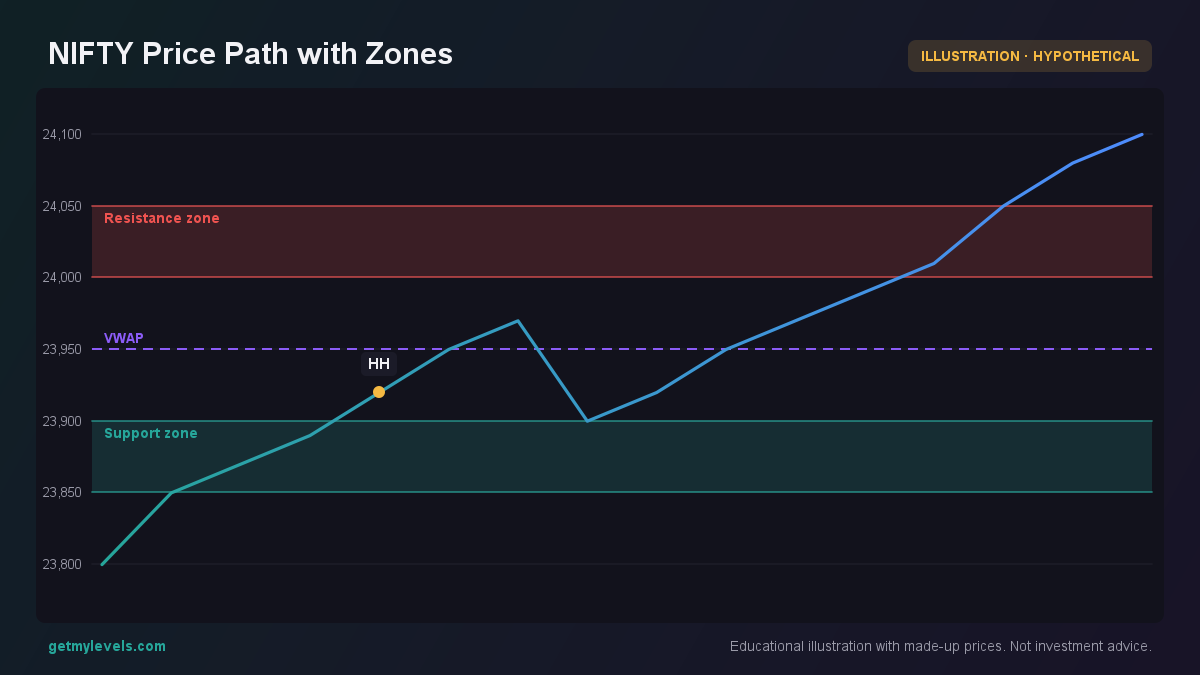 Figure 1: Price touches support zone, bounces, then approaches resistance zone
How traders read it
Suppose NIFTY is at 24,000 and the nearest support zone is 23,850-23,900. The price has already touched that zone twice in the past few days. A trader might note that the zone is “to watch” – the price may come near it again, and the zone could act as a cushion. If the price moves above the resistance zone of 24,000-24,050 and stays there, the zone has been “broke”.
Let’s look at a candle chart that illustrates a similar scenario. The candles show the open, high, low, and close for each period. A support zone is drawn as a shaded band, and a resistance zone is another shaded band. The candle at index 5 (close 23,950) touches the support zone, and the next candle (index 6) closes slightly above it, indicating a bounce. Later candles approach the resistance zone; the candle at index 9 closes just below it, suggesting the zone still holds.
The key takeaway is that zones capture the breadth of price action. A single line (e.g., a 200-period moving average) can shift quickly, whereas a zone stays relevant even if the exact price point moves slightly.
Common mistakes
- Treating a zone as a precise line – Many traders look for a price to hit exactly the middle of a zone. In reality, the price can hit any point within the band and still be considered a zone interaction.
- Ignoring the width of the zone – A very narrow zone (e.g., 10-point range) may not be as meaningful as a wider zone (e.g., 100-point range). A broader zone indicates stronger consensus among market participants.
- Overlooking volume or open interest – Support or resistance is stronger when backed by high trading volume or a significant change in option-chain open interest. Ignoring these factors can lead to misinterpretation.
- Assuming the zone will always hold – Market dynamics change. A zone that held for months can break if new information arrives or sentiment shifts.
How it fits with support and resistance zones
A classic line, such as a moving average, gives a single reference point. Zones, on the other hand, show a range where price has historically found balance. When a price approaches a zone, traders can see whether it’s near the upper or lower boundary, which can hint at whether the zone is more likely to act as a floor or a ceiling. The figure below compares a simple line (VWAP) with the two zones. The price path crosses the VWAP but stays within the support zone before moving towards the resistance zone.
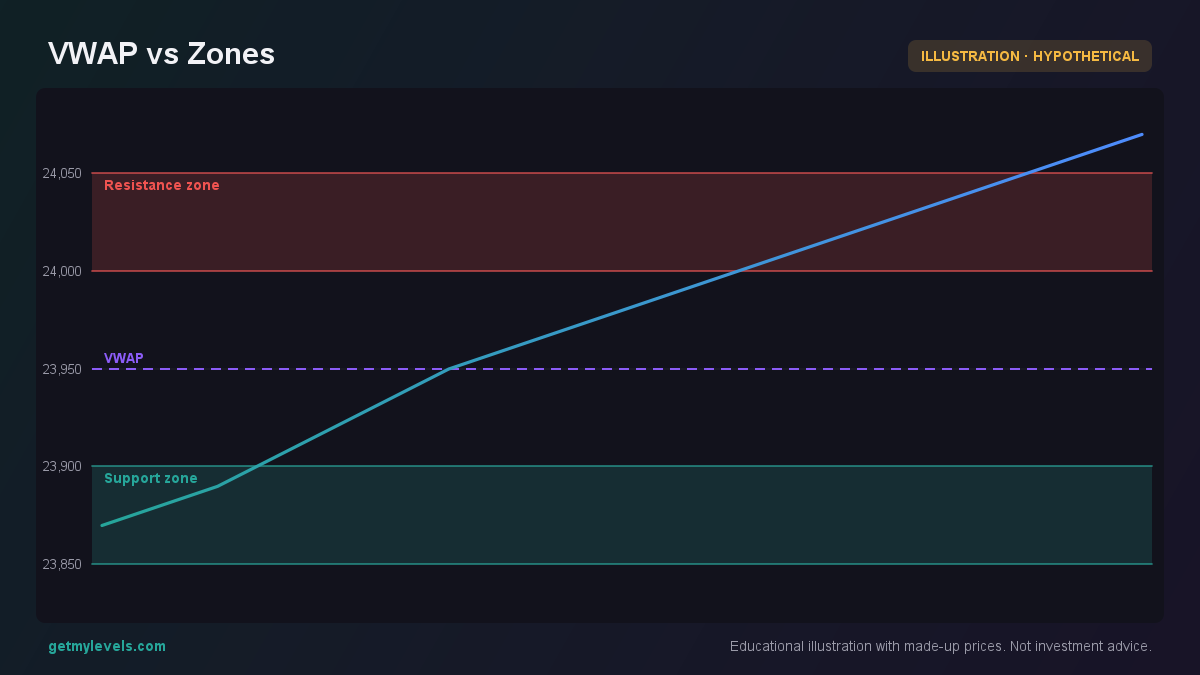 Figure 2: Price crosses VWAP but respects support and resistance zones
This visual demonstrates that while a line can give a quick snapshot, zones provide a more robust framework for understanding price behavior. Traders who rely on zones can better appreciate the nuances of market reactions.
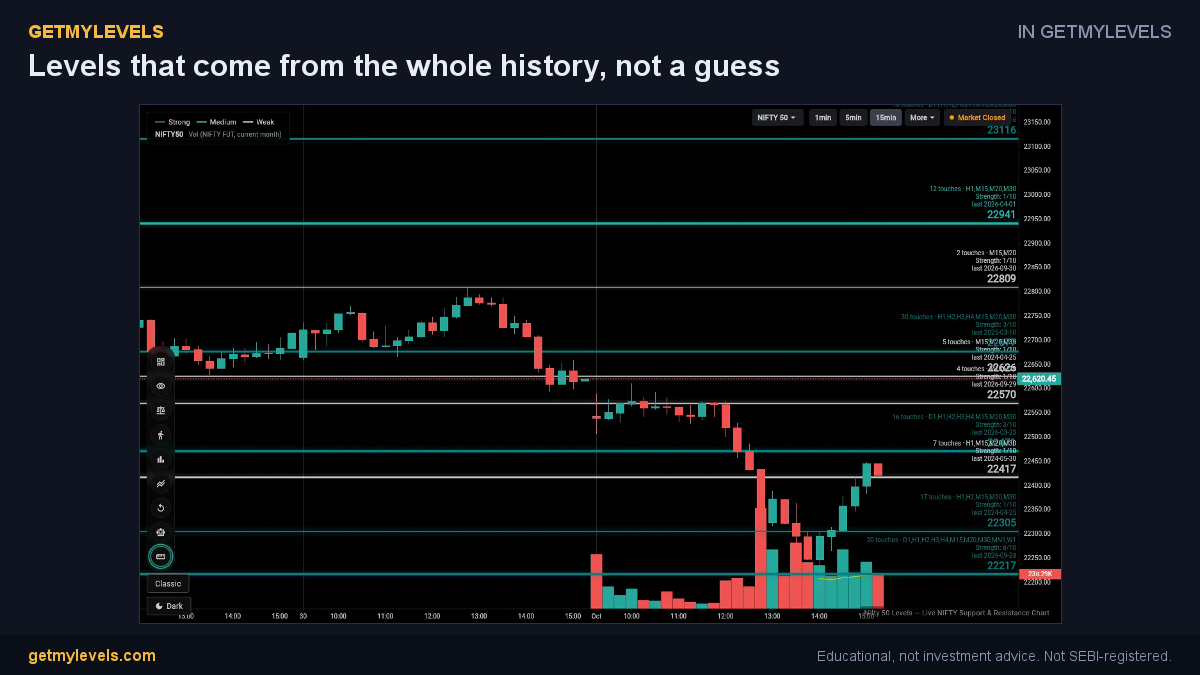 In GetMyLevels: Levels that come from the whole history, not a guess. The live chart draws this for NIFTY, BANK NIFTY and SENSEX.
Summary
- Support/resistance zones are ranges, not single points, and capture the breadth of price action.
- A price touching a zone can bounce back or break it; the zone remains relevant even if the exact price changes.
- Common pitfalls include treating zones as lines, ignoring zone width, and overlooking volume or open interest.
- Comparing a line (e.g., VWAP) with zones shows how zones offer a clearer view of price support and resistance.
- When you need live, historically-derived zones for NIFTY, BANK NIFTY, or SENSEX, tools like GetMyLevels provide those zones directly on the chart, making it easier to see where the market has shown strength in the past.
Written by an AI agent from GetMyLevels level data and checked by automated compliance rules. Educational, not investment advice. Not SEBI-registered.