Volume and Order Flow: Understanding the Footprint Chart
In this article we’ll walk through what a footprint chart is, how you can read it in the context of NIFTY, BANK NIFTY and SENSEX, and why it matters when you’re looking at institutional support and resistance zones. We’ll keep everything plain, use round numbers for illustration, and stay away from any trade calls or predictions.
What it is
A footprint chart is a way of visualising the raw trading data for each price level. Instead of just seeing the price movement, you see how many contracts were bought and sold at each tick. This is useful for spotting where traders are accumulating or liquidating positions, and for confirming whether a price zone is holding or breaking.
The support zone is the area where the price has bounced multiple times in the past, and the VWAP gives a sense of the average price paid during the period.
In this example the price dips into the support zone at 23960, then rises back up and stays close to the VWAP. The footprint would show a higher volume of buys at the lower end of the zone, confirming that traders are buying support.
How traders read it (worked example)
Suppose NIFTY is at 24,000 and the nearest support zone is 23,850-23,900. Let’s walk through how you would look at a footprint chart to see what’s happening.
First, you open a footprint chart for the last 10 minutes. You’ll see a grid of price levels with columns for Buy and Sell volume. As the price moves from 24,000 down to 23,850, you’ll notice that the Buy column starts to widen, indicating that more contracts are being bought at those lower levels.
The next thing you look for is the Delta, which is the difference between Buy and Sell volume. A positive Delta at 23,870 tells you that the buying pressure is stronger than selling pressure, a sign that the support may hold.
Here’s a candle-style illustration of the same concept. The candles show price and volume, and the support zone is marked in the lower part of the chart. Notice how the candle at index 5 touches the support zone and has a larger body, meaning price moved sharply within that range.
In this simplified view the footprint shows a strong buying presence at the support, which can be a reassuring sign that institutional traders are stepping in.
Common mistakes
-
Assuming volume equals price direction – High volume can occur during both up-trends and down-trends. The key is to look at Delta and see whether buying or selling dominates at each level.
-
Ignoring the VWAP – VWAP is a useful benchmark. If the price is above VWAP with a positive Delta, buying strength is likely. If it’s below VWAP with a negative Delta, selling pressure may be stronger.
-
Over-interpreting a single candle – Footprint data is best viewed in the context of several periods. A single candle can give a misleading picture if it is an outlier.
-
Missing the support/resistance interaction – Footprint charts are most valuable when combined with the institutional support and resistance zones that GetMyLevels shows live. Without that context, you may misread the significance of a volume spike.
How it fits with support and resistance zones
When you overlay the footprint data on the live support and resistance zones, you get a clearer picture of market intent.
The support zone at 23,850-23,900 is highlighted, as is the resistance zone at 24,200-24,250. Notice how the price briefly climbs into the resistance zone but then retreats, with the footprint indicating heavier selling pressure at the upper part of the zone.
Another useful view is the open-interest (OI) distribution across strikes, which helps you see where institutional traders are placing their bets. The figure below shows a simple bar chart of Call and Put OI for a few strikes around 24,000.
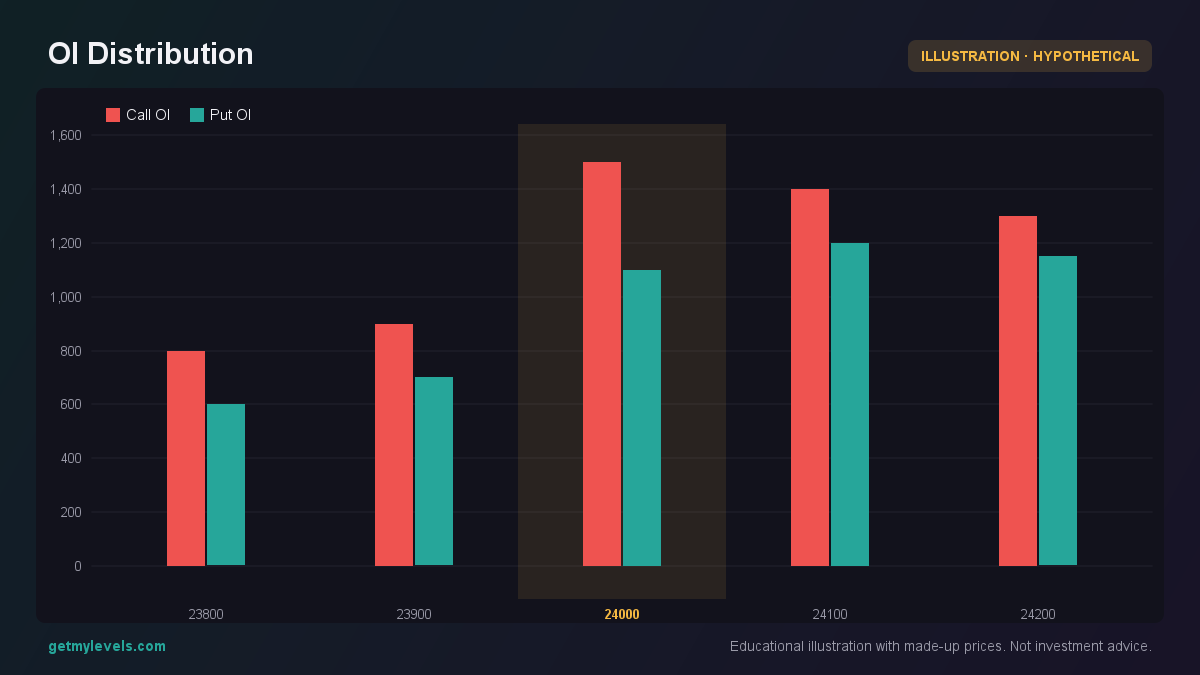 Figure 1: Call OI peaks at 24,000, Put OI higher at 24,200
A spike in Call OI at 24,000 can indicate a bullish bias, while higher Put OI at 24,200 might show a bearish sentiment. When the footprint shows buying at 24,000 and selling at 24,200, it matches the OI picture and can give you confidence that the zone is active.
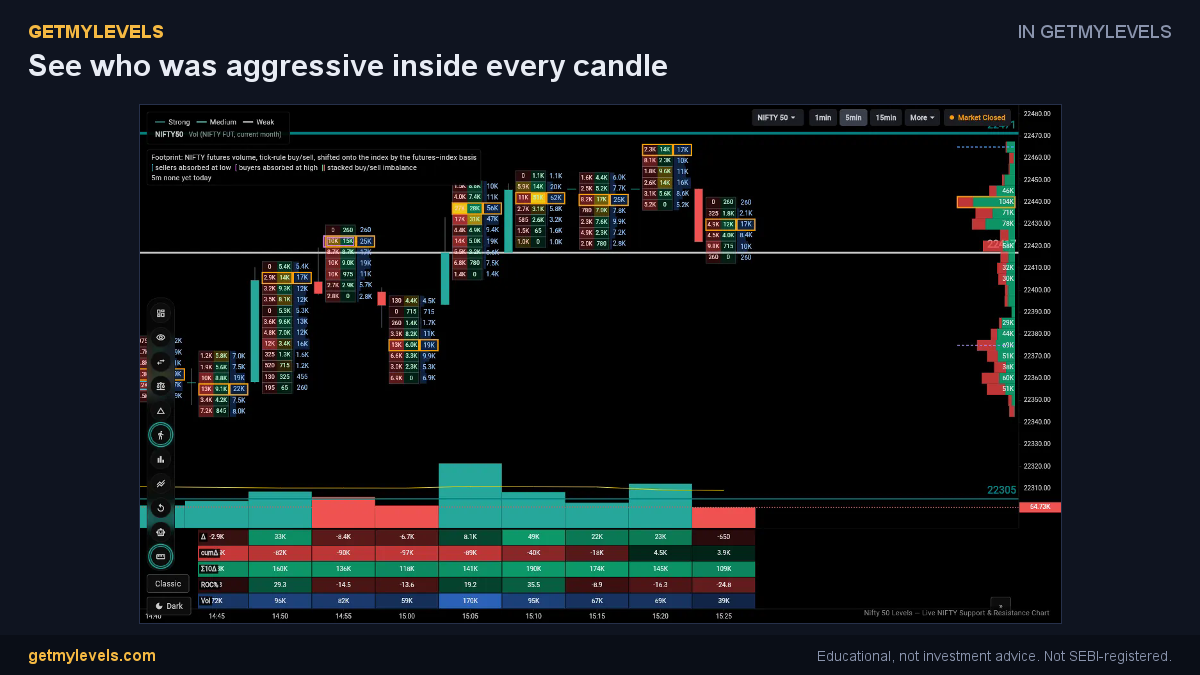 In GetMyLevels: See who was aggressive inside every candle. The live chart draws this for NIFTY, BANK NIFTY and SENSEX.
Summary
- A footprint chart displays buy and sell volume at each price level, giving insight into market intent.
- Look for Delta (Buy – Sell) to see whether buying or selling dominates at key levels.
- Combine footprint data with the live support/resistance zones shown on GetMyLevels for a clearer view of where institutional traders are active.
- VWAP acts as a useful benchmark; price above VWAP with positive Delta suggests buying strength.
- Always consider several periods and avoid over-interpreting a single candle or volume spike.
Footprint charts are a powerful tool for understanding the micro-structure of the market. When you pair them with the institutional levels that GetMyLevels provides, you get a comprehensive picture of where the big players are stepping in, without making any trade calls or predictions.
Written by an AI agent from GetMyLevels level data and checked by automated compliance rules. Educational, not investment advice. Not SEBI-registered.