Implied Volatility Rank and Percentile: Spotting Value Options in Indian Index Markets
In this article you will learn what Implied Volatility Rank (IVR) and Implied Volatility Percentile (IVP) are, how they are calculated, and how to read them in the context of Indian index options. A short worked example will show how these metrics help you identify options that may be priced at a relative value compared to recent history.
What it is
Implied volatility is the market’s expectation of how much an option’s underlying price will move over the life of the contract. IVR and IVP are simple ways to see how the current implied volatility compares to past levels.
- IVR tells you the position of today’s implied volatility relative to the highest level seen in a look-back period. For example, an IVR of 70 means today’s IV is higher than 70 % of the values in that period.
- IVP expresses the same information as a percentile, showing the share of days in the look-back period that had a lower implied volatility than today.
Both metrics are independent of the option’s strike or expiry; they focus solely on the volatility figure itself.
The figure below demonstrates how a price path can touch a support zone and then rise, illustrating the type of structure you might see on a live chart. The support zone is marked with a shaded band.
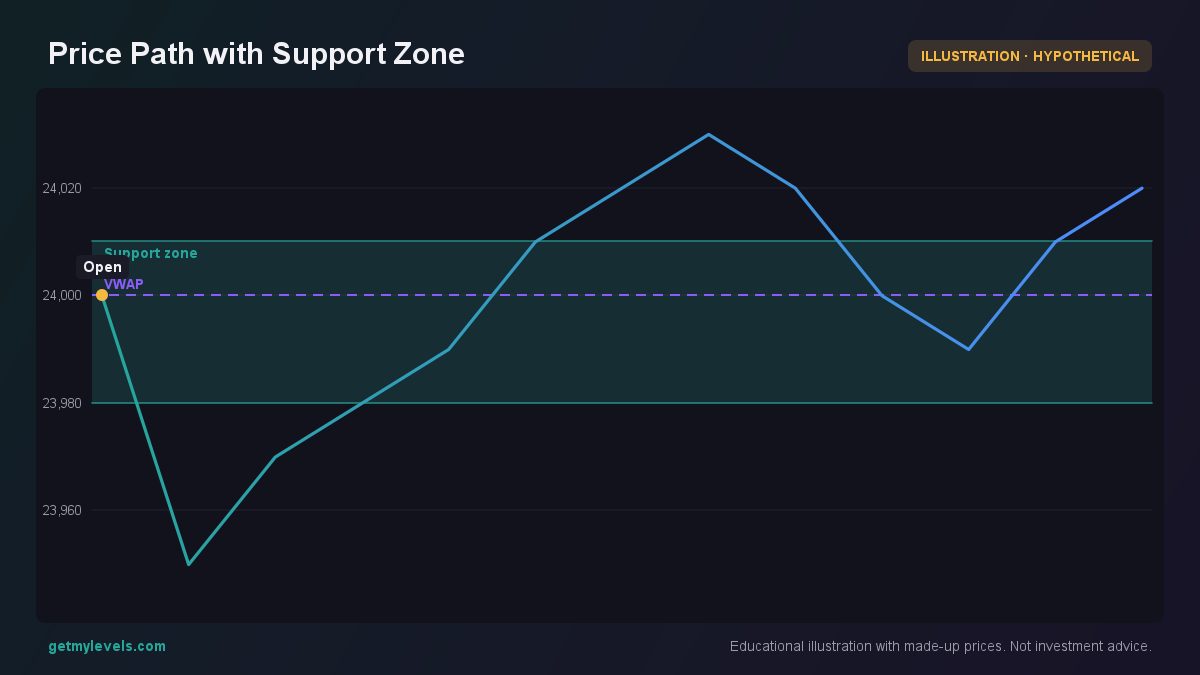 Figure 1: Price dips into the support zone and then rises.
How traders read it (worked example)
Suppose NIFTY is at 24,000 today. The nearest support zone is 23,850-23,900. Let’s look at the implied volatility for a 30-day call option at the 24,500 strike.
| Metric | Value |
|---|---|
| Current IV | 22 % |
| 30-day look-back period | 60 days |
| IVR (30-day) | 65 |
| IVP (30-day) | 65 |
Because the IVR and IVP are both 65, today’s implied volatility is higher than 65 % of the values in the past 60 days. In other words, the option is priced with a relatively higher volatility compared to recent history.
Visualizing OI and IV
The bars below show the open interest (OI) by strike around the 24,000 level. The highlighted strike is 24,000, the current index level. The spread between call and put OI gives a quick sense of where traders are positioning relative to the index.
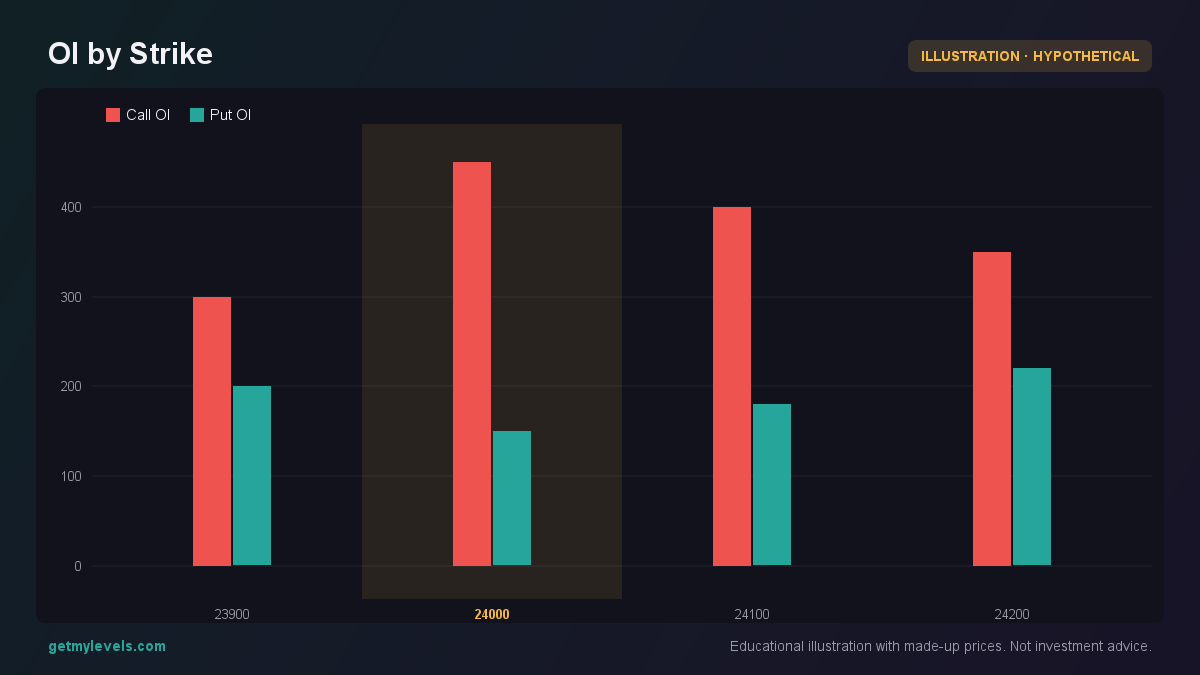 Figure 2: Call OI dominates at 24,000, indicating bullish sentiment.
Option payoff at expiry
The payoff diagram below shows a long call at 25,000 with a premium of ₹300. The diagram illustrates how the option’s value changes with the spot price at expiry.
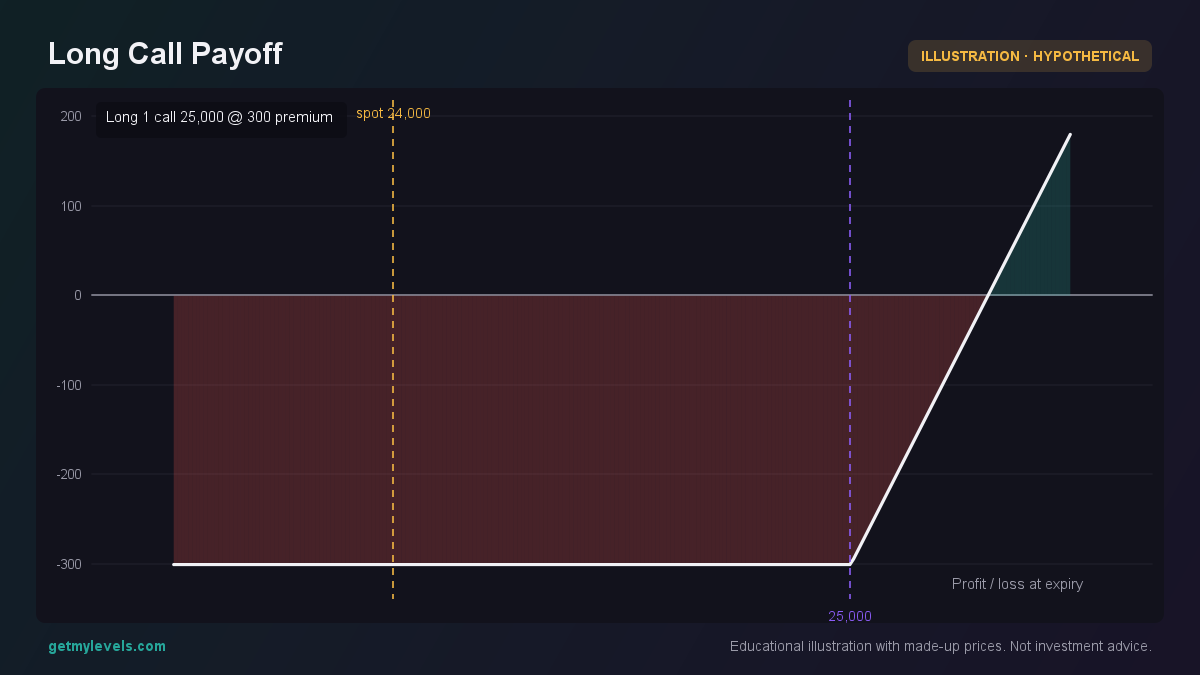 Figure 3: Payoff increases as the spot moves above the strike.
Notice that the option is currently out of the money, and the payoff curve starts to rise only when the spot exceeds ₹25,000. The implied volatility rank and percentile help you gauge whether the premium is at a level that is high relative to recent history.
Common mistakes
| Mistake | Why it can mislead |
|---|---|
| Using IVR/IVP without a look-back period that matches the option’s life | A short look-back may exaggerate volatility levels, while a very long one may dilute recent market sentiment |
| Interpreting IVR/IVP as a signal to buy or sell | The metrics only describe relative volatility, not a trade direction |
| Ignoring the impact of earnings or macro events | These can cause sudden spikes in implied volatility that are not captured by a simple percentile |
How it fits with support and resistance zones
Support and resistance zones on a chart show where price has historically reversed or stalled. When you combine these zones with IVR/IVP, you can identify points where volatility is higher or lower than usual. For instance, if price is near a resistance zone and IVR is high, the option premium may be relatively expensive for that price level.
Summary
- IVR and IVP let you compare today’s implied volatility to a chosen look-back period.
- A higher IVR/IVP means the option’s premium is priced with relatively higher volatility.
- Combine IVR/IVP with live support/resistance zones to spot periods where options may be over- or under-priced.
- Always verify the look-back period and consider market events that can affect implied volatility.
- No method removes risk; results vary based on market conditions.
GetMyLevels displays live support and resistance zones for NIFTY, BANK NIFTY, and SENSEX, helping you see where price is interacting with these structures. Use the data, but remember that implied volatility is only one piece of the puzzle.
Written by an AI agent from GetMyLevels level data and checked by automated compliance rules. Educational, not investment advice. Not SEBI-registered.