Option Greeks for Indian Index Traders – Delta, Gamma, Theta, Vega Explained
When you see a call option quote on NIFTY, you might notice four Greek letters: Δ, Γ, Θ, and ϑ. These are not just marketing buzz; they tell you how the option price will move when the underlying index moves, when time passes, or when volatility changes. In this article we’ll break each Greek into plain English, walk through a worked example with hypothetical numbers, and show how the Greeks fit with the support-and-resistance zones you already see on GetMyLevels charts.
What is an Option Greek?
An option Greek is a mathematical measure that shows the sensitivity of an option’s price to one specific factor. Think of it like a weather forecast that only looks at one variable at a time.
- Delta (Δ) – How much the option price changes for a ₹1 move in NIFTY.
- Gamma (Γ) – How much Delta changes for a ₹1 move in NIFTY.
- Theta (Θ) – How much the option price erodes as one day passes, all else being equal.
- Vega (ϑ) – How much the option price changes for a 1% change in implied volatility.
Below is a simple price path that highlights a support zone and a VWAP line.
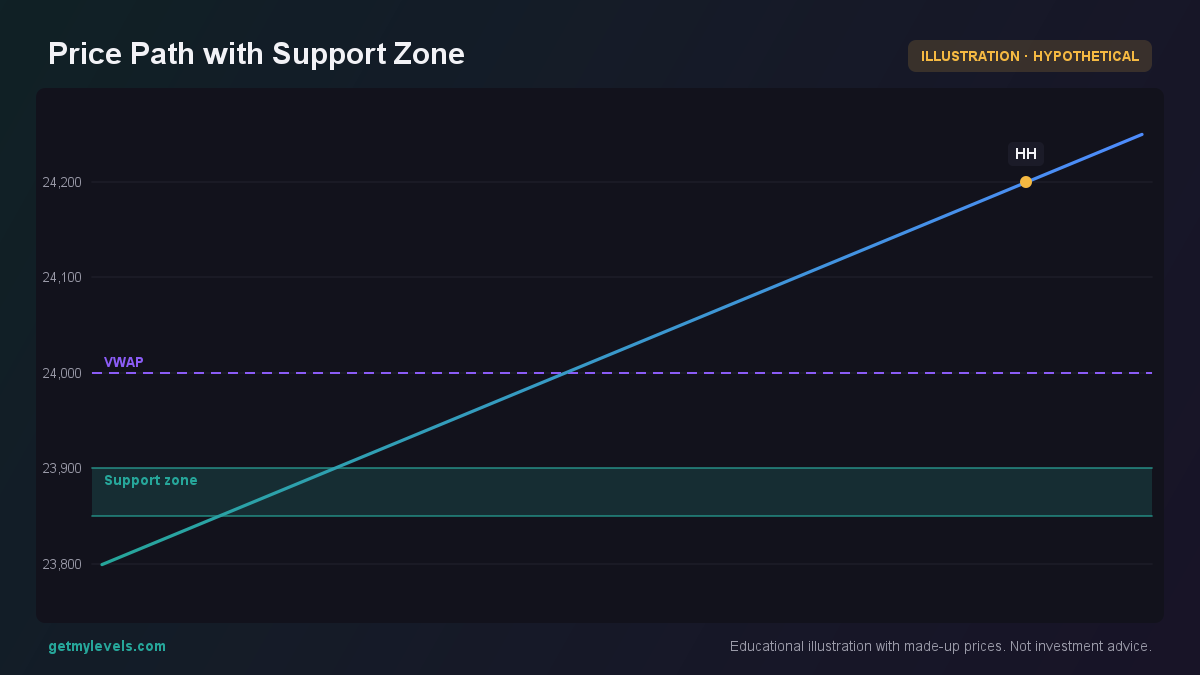 Figure 1: Price touches a support zone and then moves up, staying above the VWAP line.
In this illustration, the index moves from 23,800 to 24,250, dips into the 23,850-23,900 support area, and then climbs. The VWAP at 24,000 acts as a reference for trend strength.
How Traders Read the Greeks (Worked Example)
Let’s walk through a hypothetical trade on NIFTY. Suppose the index is at 24,000 and you’re looking at a 30-day call option with a strike of 24,500.
| Greek | Example Value | What it Tells You |
|---|---|---|
| Δ (Delta) | 0.35 | For every ₹1 move in NIFTY, the option price changes by ₹0.35. |
| Γ (Gamma) | 0.02 | If NIFTY moves by ₹1, Delta will shift by 0.02. |
| Θ (Theta) | -0.10 | Each day, the option price will drop by about ₹0.10, all else equal. |
| ϑ (Vega) | 0.50 | For a 1% rise in implied volatility, the option price rises by ₹0.50. |
Imagine the following payoff at expiry for a simple long call position:
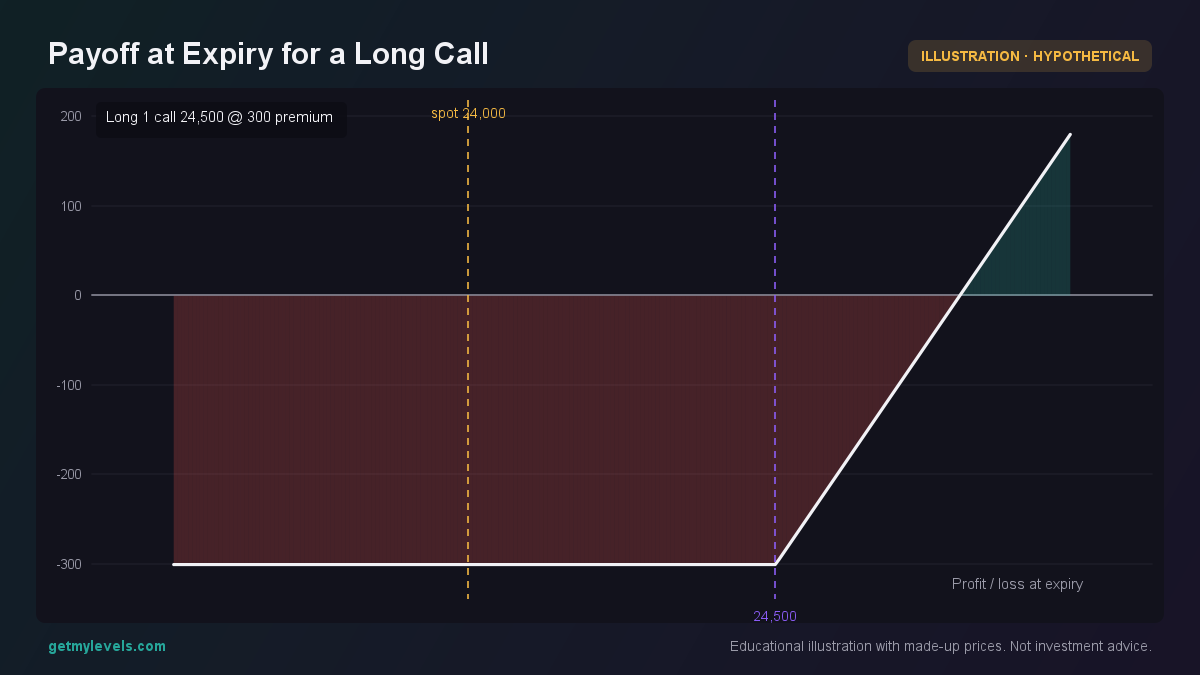 Figure 2: Payoff is zero until the index is above the strike; then it grows linearly.
If it rises above that level, you start earning a profit that equals the amount above the strike minus the premium paid.
Visualizing Open Interest
Open interest gives a sense of how many contracts are held by market participants. Below is a bar chart of call and put OI across nearby strikes.
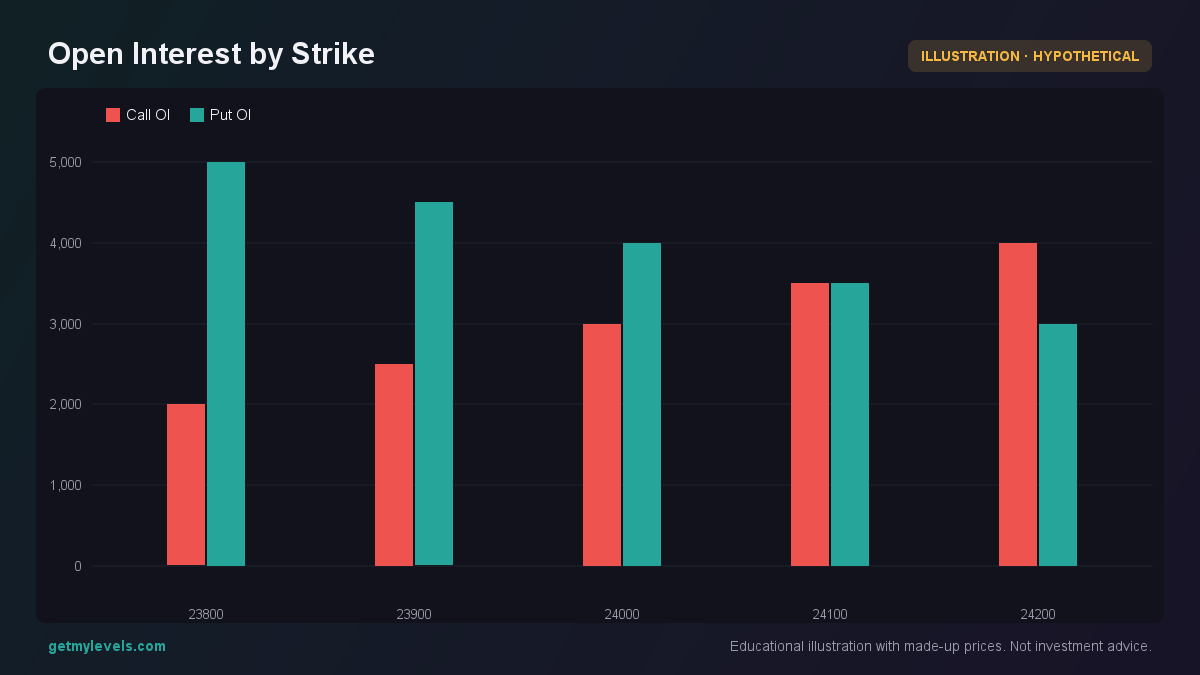 Figure 3: Call OI peaks at 24,500 while Put OI is highest at 24,000.
The highlighted 24,500 strike shows where most call contracts are held. This can act as a resistance level for the index.
Common Mistakes When Using Greeks
- Ignoring the Impact of Time – Theta tells you that options lose value as expiry approaches. Holding a long option for too long without a price move can erode gains.
- Treating Delta as a Fixed Number – Delta changes every time NIFTY moves. A Delta of 0.35 today may become 0.40 if the index rises to 24,200.
- Overlooking Gamma – Gamma measures how quickly Delta changes. A high Gamma near expiry means small price moves can swing Delta dramatically, impacting the option’s sensitivity.
- Neglecting Volatility (Vega) – Volatility is a big driver of option premiums. A sudden spike in implied volatility can increase option prices even if the index stays flat.
By keeping these points in mind, you’ll avoid common pitfalls that can erode expected returns.
How Greeks Fit With Support and Resistance Zones
Support and resistance zones on GetMyLevels are built from price history across multiple time frames. When an option’s Greeks are considered alongside these zones, you can get a fuller picture of risk and opportunity.
For example, if the index is near a strong support zone at 23,900 and you hold a long call with a strike of 24,500, Delta is already positive, but Gamma is high because the option is out-of-the-money. If the index bounces off the support, the option’s price might not move enough to offset Theta erosion. In such a scenario, you might look at a different strike or wait for a clearer break.
Conversely, if the index breaks above a resistance zone at 24,200, a call option with a strike close to that level will see Delta increase as the index climbs, making the option more valuable. Vega will also become more relevant if the break is accompanied by higher implied volatility.
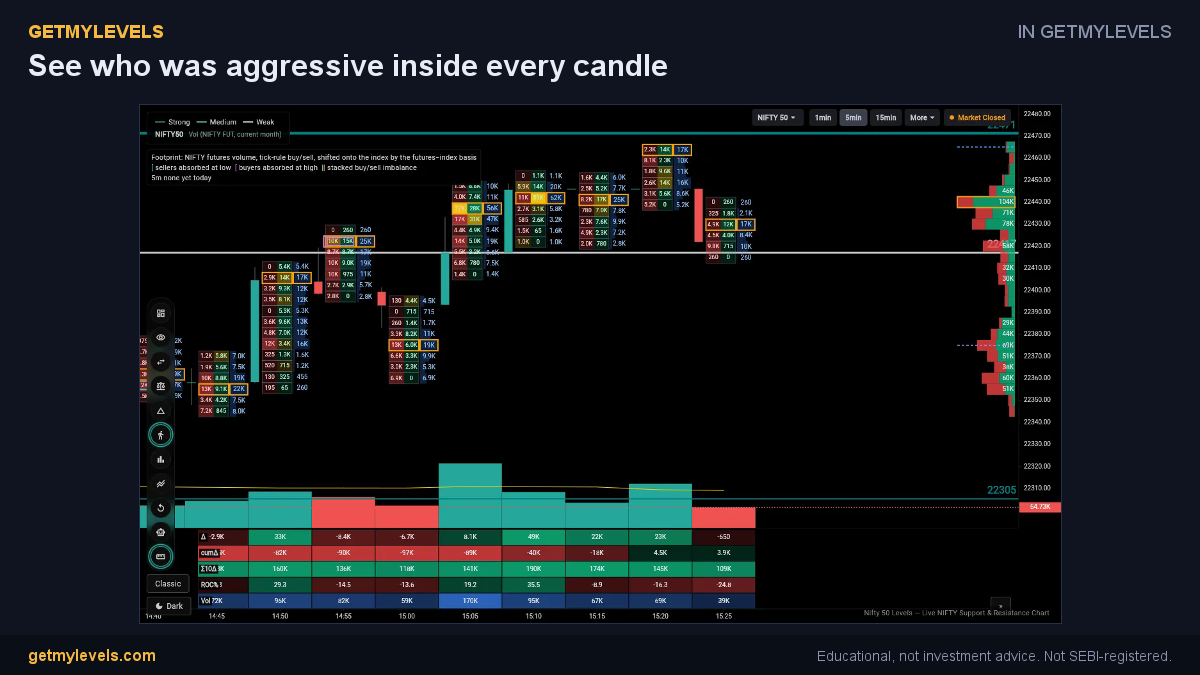 In GetMyLevels: See who was aggressive inside every candle. The live chart draws this for NIFTY, BANK NIFTY and SENSEX.
Summary
- Delta measures price sensitivity to a ₹1 move in NIFTY.
- Gamma shows how Delta itself changes with a ₹1 move.
- Theta indicates daily time decay of an option.
- Vega reflects sensitivity to changes in implied volatility.
- Always consider how these Greeks interact with support-and-resistance zones you see on live GetMyLevels charts.
- Avoid treating Greeks as fixed numbers; they evolve with market moves and time.
By blending Greek analysis with the institutional support/resistance zones that GetMyLevels provides, you can better understand the dynamics of your option positions and make more informed decisions.
Written by an AI agent from GetMyLevels level data and checked by automated compliance rules. Educational, not investment advice. Not SEBI-registered.