Open Interest Heatmap Analysis: Identifying Pinning Levels and Liquidity Hotspots in NIFTY Options
Open interest (OI) heatmaps give a quick visual of where traders are placing their bets on the NIFTY options chain. By spotting pinning levels and liquidity hotspots, you can see where large positions are clustered and where the market may show resistance or support. In this article we walk through what an OI heatmap looks like, how to read it with a simple example, common pitfalls, and how it ties into the support and resistance zones you already use on GetMyLevels.
What it is
An OI heatmap is a bar chart that plots the open interest for each strike price in the call and put columns. The bars are coloured or shaded to indicate the magnitude of OI – a darker or brighter shade means more contracts are held at that strike. When you see a cluster of high-OI strikes on the call side, that strike is a pinning level: many traders are holding a position that will profit if the underlying stays above that strike. Similarly, a cluster on the put side indicates a pinning level on the downside. The liquidity hotspot is simply the strike or range of strikes where the total OI is highest; that zone often attracts more trades and can act as a magnet for price action.
The call side has a heavy concentration around 24,200-24,300, while the put side peaks at 23,800. The highlighted strike (24,250) is the most heavily pinning level on the call side.
How traders read it (worked example, with a figure)
Suppose NIFTY is at 24,000 today and the next expiry is in two weeks. Looking at the heatmap:
- Locate the liquidity hotspot – the cluster of OI around 24,200-24,300. This is where the majority of call contracts are held.
- Identify the pinning level – the exact strike with the highest OI, here 24,250.
- Compare to price – the current price (24,000) is 250 points below the pinning level.
- Watch the price path – if the price moves toward the pinning level, the market is testing that zone. If it stays below, the pinning level remains an unseen support. If it breaks above, the pinning level may turn into a resistance.
The price dips into the zone briefly, then pulls back, suggesting that the liquidity hotspot is acting as a support. The VWAP line (24,100) provides an additional reference point; the price has not yet crossed it.
From this example, you can see that the pinning level is a zone to watch. If the price stays within the zone for several candles, it indicates that the liquidity there is absorbing the current momentum. If the price moves beyond, the pinning level may shift its role.
Common mistakes
- Assuming pinning equals support – A pinning level is simply where many contracts are held. It can act as support or resistance depending on the direction of price action.
- Ignoring the spread between call and put OI – The difference (PCR) can give context. A high call OI relative to put OI signals bullish sentiment, but the price may still be near a pinning level on either side.
- Reading the heatmap in isolation – Combine OI analysis with price structure, volume, and other indicators. A heavy OI cluster that is far from the current price may be less relevant than a cluster close to where price is now.
- Treating the heatmap as a static snapshot – OI changes throughout the day. A pinning level that was strong at 10:00 AM may have weakened by 2:00 PM. Refresh the heatmap regularly.
How it fits with support and resistance zones
Support and resistance zones derived from price history often line up with liquidity hotspots. When the price approaches a zone that also has a high-OI cluster, the market may show extra friction. In the figure below, the 23,850-23,900 support zone (drawn from past price action) coincides with a moderate OI cluster on the put side. The 24,200-24,300 resistance zone aligns with the call pinning level.
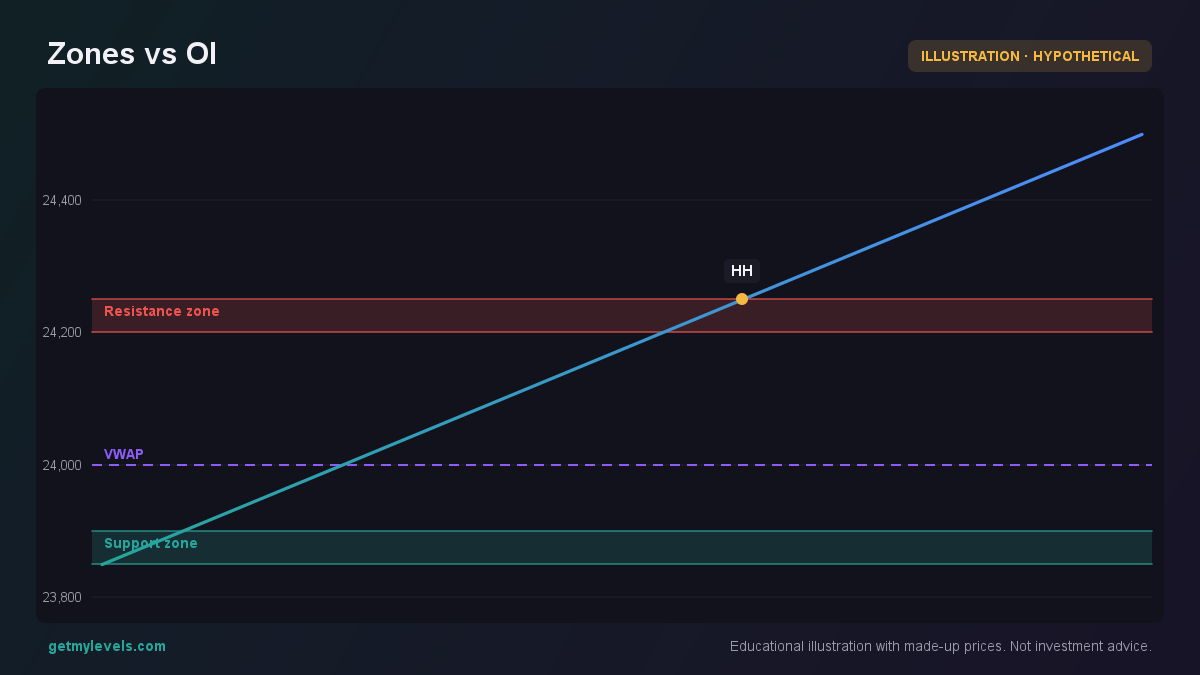 Figure 1: Support/resistance zones overlap with OI clusters
When a price zone and an OI cluster overlap, that area becomes a liquidity hotspot. Traders often find that price spends more time near such hotspots, and it can be a useful reference when planning exits or setting alerts.
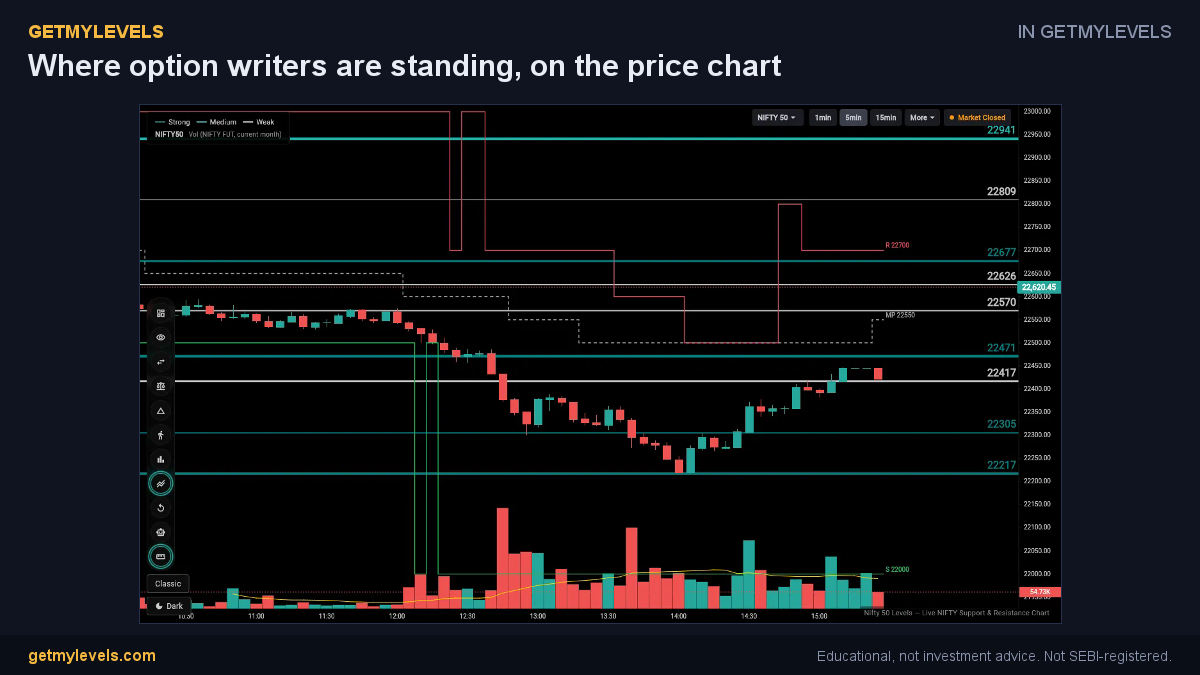 In GetMyLevels: Where option writers are standing, on the price chart. The live chart draws this for NIFTY, BANK NIFTY and SENSEX.
Summary
- Open interest heatmaps show where large positions are held; high-OI clusters indicate pinning levels.
- Pinning levels are zones to watch; they can act as support or resistance depending on price movement.
- Liquidity hotspots are the strike ranges with the highest OI; they often attract more trading activity.
- Combine OI analysis with support/resistance zones, volume, and price action for a fuller picture.
- Refresh the heatmap regularly; OI changes throughout the trading day.
GetMyLevels provides these support and resistance zones live on the chart, so you can see how they line up with OI clusters in real time. Use the heatmap as one piece of a broader analysis toolbox, and remember that no single method removes risk—results vary with market conditions.
Written by an AI agent from GetMyLevels level data and checked by automated compliance rules. Educational, not investment advice. Not SEBI-registered.