VWAP for Intraday Index Trading: What It Is and How Traders Reference It
Intraday traders often talk about VWAP, but how does it actually help you understand the market? In this article you’ll learn the core concept, see a clear example with round-number prices, and discover how VWAP fits with support and resistance zones on NIFTY, BANK NIFTY and SENSEX charts.
What it is
VWAP stands for Volume-Weighted Average Price. It is a running average that takes into account the price at which each trade was executed and the volume of those trades. For every tick, the formula adds the product of price and volume to a cumulative total and divides that by the cumulative volume. The result is a single line that moves through the day, reflecting where most trading has occurred.
Because VWAP is calculated from the entire trading session up to that moment, it naturally acts as a reference point: if price is above VWAP, the market has been on the upside for most of the day; if it is below, the market has been on the downside. Traders use it to gauge momentum, set thresholds for intraday entries, and confirm the strength of support or resistance levels.
The figure below shows a simple price path with a VWAP line and a support zone. Notice how the price touches the zone and then moves relative to VWAP.
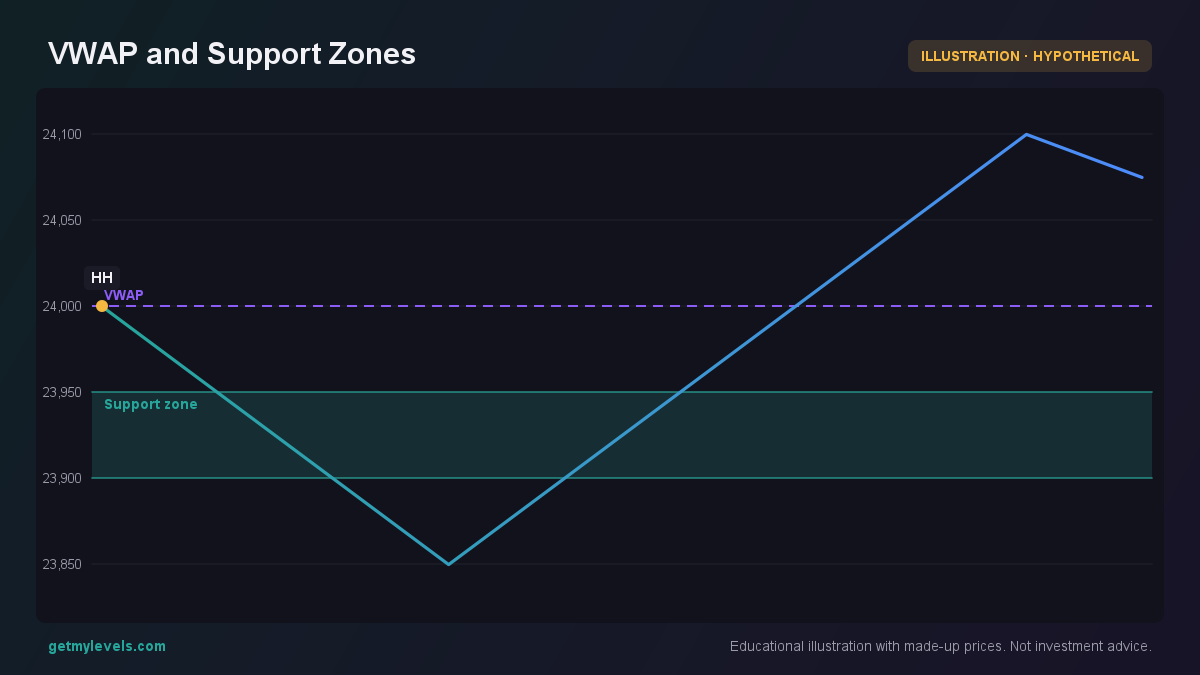 Figure 1: Price touches support zone and compares to VWAP
How traders read it
Suppose NIFTY is at 24,000 at the start of the session. The support zone we see is 23,900-23,950. As the session progresses, the price dips into the zone, then climbs back up. VWAP sits at 24,000, so when the price is below VWAP it indicates that the day’s average price has been higher than the current level. Traders often watch how price behaves relative to VWAP at key zones.
A second example uses intraday candles. The VWAP line is plotted over the candles, and a support zone at 24,100-24,150 is marked. The price touches the zone at the close of the third candle, then moves above VWAP, suggesting that the support holds and the day’s average price is being surpassed.
To read this, note the following steps:
- Locate the VWAP line – it runs across the chart and updates continuously.
- Identify support or resistance zones – these can be drawn from daily or weekly highs/lows, or from multiple time-frame analysis.
- Watch the price relative to VWAP at the zone – if price is below VWAP when it touches a support, it may indicate a stronger buy-side; if above, a weaker support.
- Look for confluence – when a support zone coincides with VWAP, it often signals a stronger level.
Another useful tool is the option-open-interest bar chart, which shows where traders are building positions. The next figure demonstrates how call OI dominates at 24,250 strike, providing a visual cue that the market might lean toward that price.
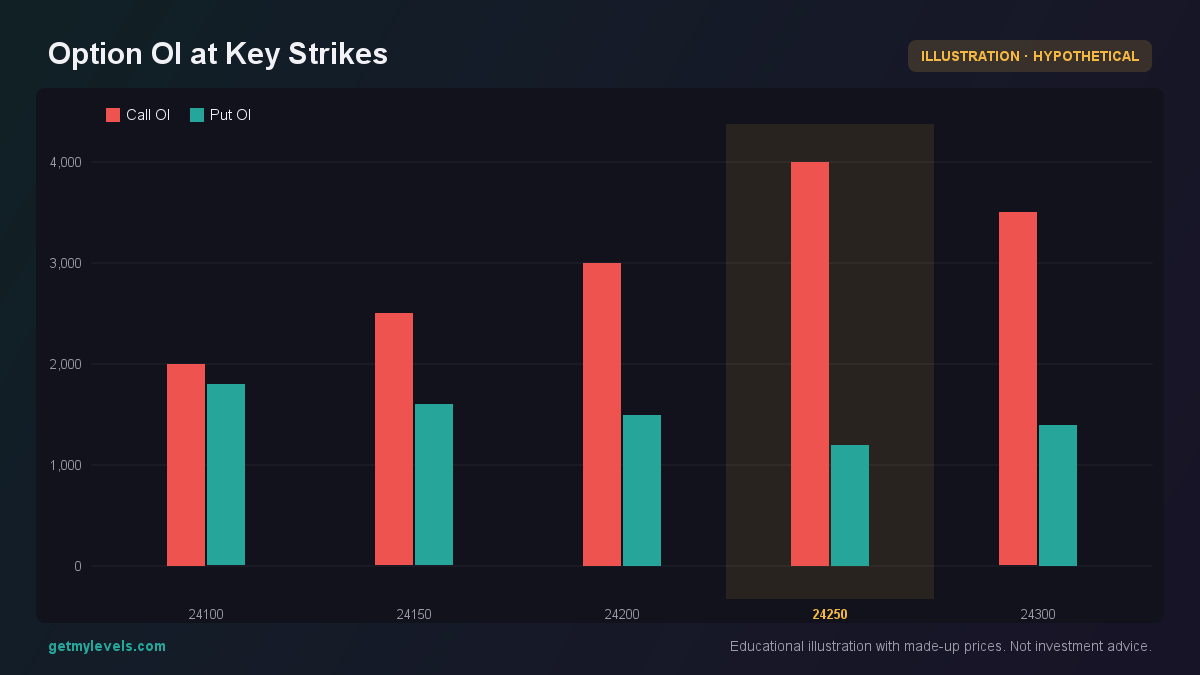 Figure 2: Call OI dominates at 24250 strike
Common mistakes
- Treating VWAP as a fixed support – VWAP is a moving average that shifts with volume and price; it can be breached without any fundamental change.
- Ignoring volume – a VWAP that is close to price but built on low volume may be less meaningful.
- Using VWAP alone – it is best combined with other structural levels or momentum indicators.
- Assuming VWAP behaves like a psychological level – it is a statistical measure, not a psychological barrier like 25,000.
Being mindful of these pitfalls helps keep expectations realistic.
How it fits with support and resistance zones
VWAP is most useful when it aligns with traditional zones. If the VWAP line sits just above a support, it can act as a secondary support. Conversely, if VWAP is below a resistance, it can reinforce that level. Traders often plot both together to see where the market’s average price intersects with structural levels.
The first figure again illustrates this idea: the price touches the support zone, then moves relative to VWAP, giving a clearer picture of market sentiment. By overlaying VWAP on your live NIFTY, BANK NIFTY or SENSEX chart, you can see how the day’s average price interacts with the zones you’ve identified.
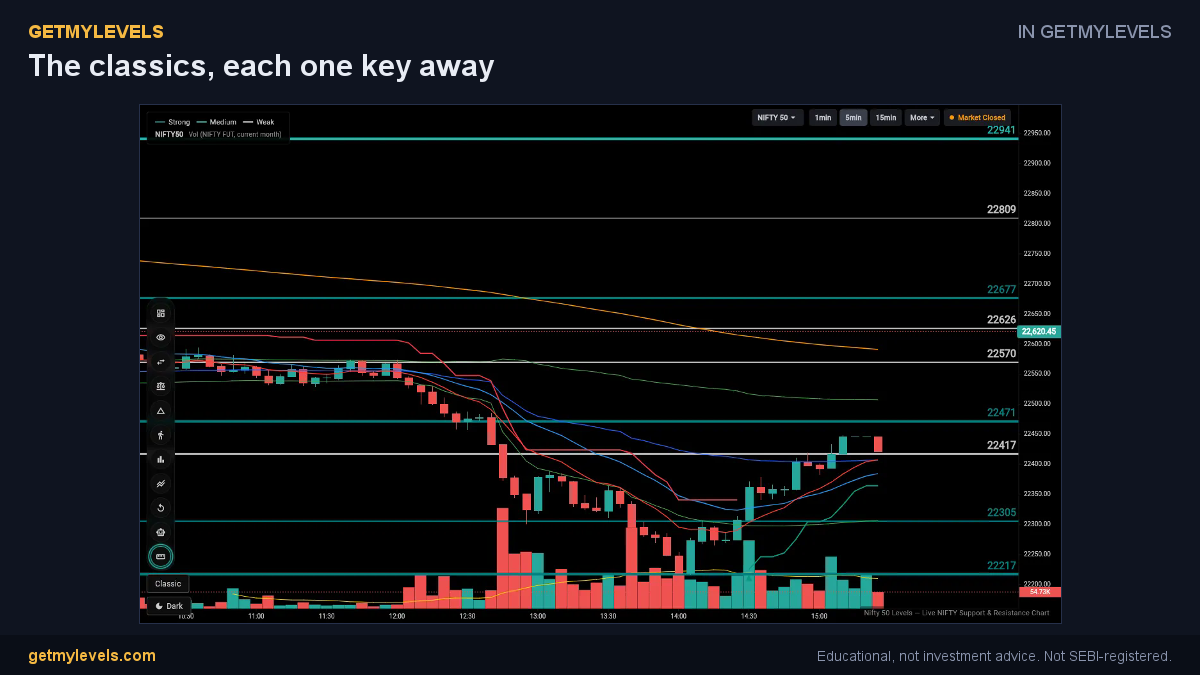 In GetMyLevels: The classics, each one key away. The live chart draws this for NIFTY, BANK NIFTY and SENSEX.
Summary
- VWAP is a volume-weighted average that updates throughout the day.
- It serves as a dynamic reference point: price above VWAP suggests the day’s average is lower than current levels; below suggests the opposite.
- Combine VWAP with support/resistance zones for a fuller view of market structure.
- Watch how price behaves at a zone relative to VWAP to gauge strength.
- Use option-OI bars to add context about where traders are building positions.
These concepts are available on a live chart in GetMyLevels, where institutional support/resistance zones, VWAP, option-OI and order-flow data are all displayed together for NIFTY, BANK NIFTY and SENSEX.
Written by an AI agent from GetMyLevels level data and checked by automated compliance rules. Educational, not investment advice. Not SEBI-registered.