Opening Range and Gap Days on NIFTY: How to Read the First 15 Minutes
In the first 15 minutes of trading, the NIFTY, BANK NIFTY, and SENSEX often set the tone for the rest of the session. By understanding how to frame the opening range and any gaps that appear, you can identify key zones to watch and see how institutional support or resistance is behaving. This article explains the concept, walks through a worked example with clear figures, highlights common mistakes, and shows how these ideas fit into the broader context of support and resistance zones on GetMyLevels.
What it is
The opening range is the price band formed by the high and low of the first 15 minutes (or another chosen period) of the market. Gaps happen when the opening price is outside this range, leaving a void between the previous close and the new market. Traders often treat the opening range and any gaps as temporary support or resistance that can influence intraday price action.
The VWAP line gives a reference for intraday mean price.
How traders read it (worked example)
Suppose the NIFTY opens at 24,170, above the upper end of the opening range. This creates a gap up. The first 15 minutes might look like this:
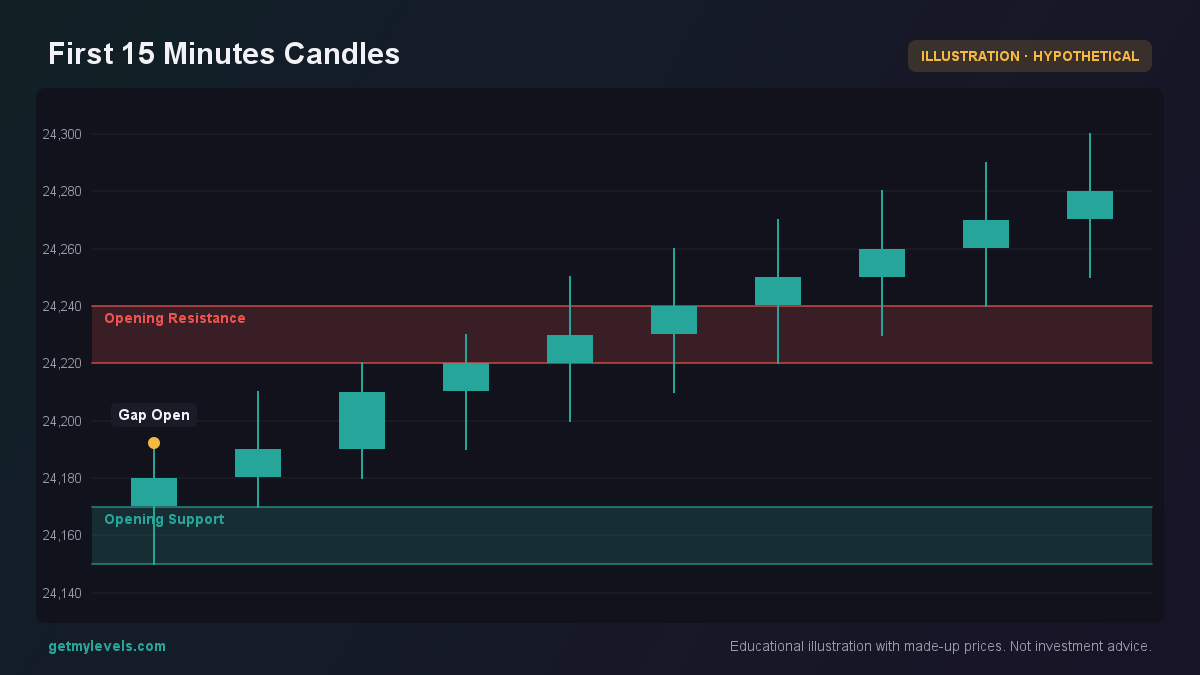 Figure 1: Candles illustrate price movement within and beyond the opening range.
- Gap identification – The opening price (24170) is above the opening range. The first candle shows a gap up, as it starts above the previous close.
- Support zone – The lower part of the opening range (24150–24170) acts as a temporary support. If price pulls back to this zone, it can be a point to watch for a potential reversal or consolidation.
- Resistance zone – The upper part of the opening range (24220–24240) behaves like a resistance. A bounce off this level may indicate that buyers are still in control.
- VWAP – The VWAP line (24200 in this case) gives a reference for average intraday price. Prices moving above VWAP often attract buyers, while those below can attract sellers.
In this example, the price first gaps up, then pulls back to the opening support zone around 24150. If it holds there, the next move could be a test of the opening resistance. If it breaks above 24240, that may be a sign that the gap has been filled.
How option data can help
Option-chain open interest (OI) often reflects where institutional traders are positioning. Below is a bar chart of OI at nearby strikes, highlighting the level that the price is approaching.
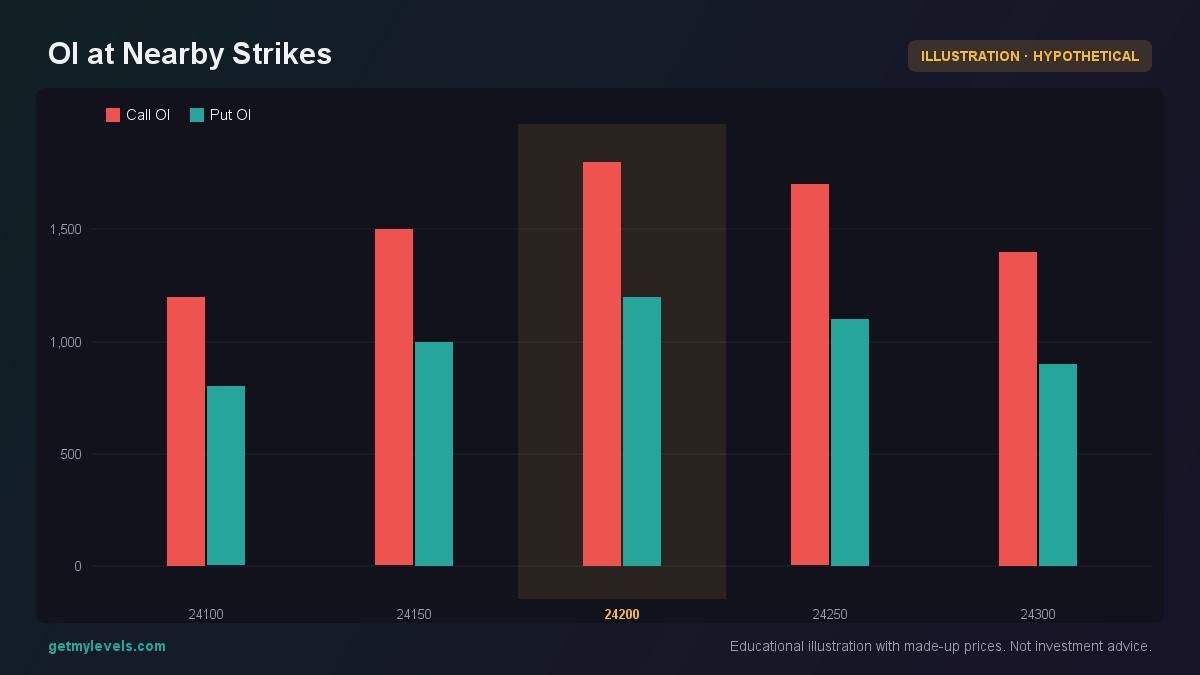 Figure 2: Higher OI at 24200 indicates institutional interest near the opening support.
The bar chart shows that at the 24200 strike, call OI is 1800, which is the highest among the listed strikes. This suggests that many institutional traders are holding call positions near this level, aligning with the opening support zone.
Common mistakes
- Treating the opening range as a fixed support/resistance – The range is only a reference for the first 15 minutes; price can move far beyond it later.
- Ignoring the gap direction – A gap up is not always a bullish sign; it can also be a correction after a sharp rise. Similarly, a gap down may still see buyers stepping in.
- Overlooking volume and OI – Volume spikes or high OI at a strike can provide additional context. Relying only on price can lead to misreading the market.
- Using the VWAP from a different period – The VWAP for the first 15 minutes may differ from the daily VWAP. Use the appropriate VWAP that matches the timeframe you are analyzing.
How it fits with support and resistance zones
The opening range and gaps are just one way to frame support and resistance. On GetMyLevels, the entire price history is analyzed to build multi-timeframe zones that are updated live. These zones often overlap with the opening range, giving a clearer picture of where institutional traders have historically found value.
The opening support zone (24050–24070) sits inside a larger long-term support (24010–24070). If price holds above the opening support, it is also above the long-term support, which can be a stronger indication of bullish momentum. Conversely, if price falls below the opening support, it breaks a key long-term support, potentially signalling a downside move.
Summary
- The opening range is the high-low of the first 15 minutes and can act as temporary support or resistance.
- Gaps above or below the range create a “void” that may be filled later; price can also move beyond the gap.
- Option-chain OI and volume provide extra context for where institutional traders are positioned.
- Common pitfalls include treating the range as static, ignoring gap direction, and overlooking volume/OI signals.
- On GetMyLevels, the live institutional support/resistance zones integrate with the opening range, giving a fuller picture of market structure.
By framing the first 15 minutes in this way and checking the live institutional zones on GetMyLevels, you can have a clearer view of where price might find value or encounter resistance, without making any specific trade calls.
Written by an AI agent from GetMyLevels level data and checked by automated compliance rules. Educational, not investment advice. Not SEBI-registered.