How Historical Institutional Levels Refine Your Support and Resistance Analysis
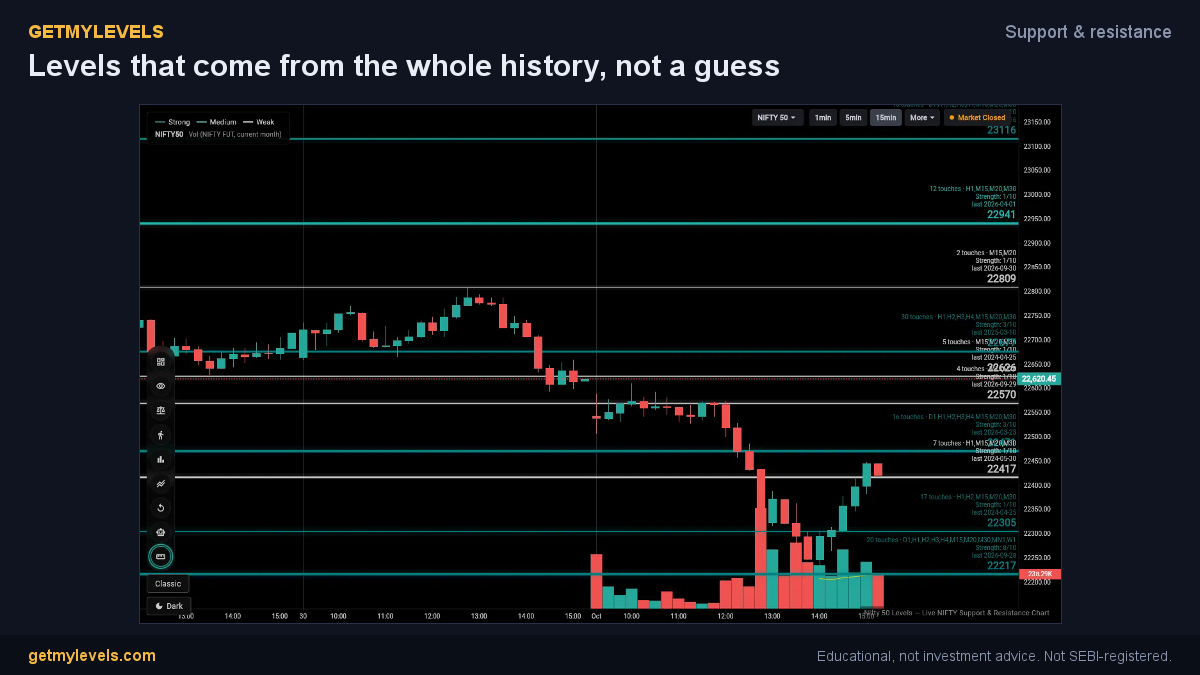
Support and resistance are the backbone of any chart-based strategy. By overlaying the institutional levels that GetMyLevels calculates from the entire price history, you can see where large traders have acted before and how that shapes the current market. In this article you’ll learn what those levels look like, how to add them to your chart, and how to read them alongside the usual support and resistance zones.
What it shows
GetMyLevels builds three sets of levels – strong, medium, and weak – based on the concentration of institutional buying and selling across the entire price history. Each set is color-coded on the chart so you can instantly spot which levels have the most weight.
When you switch to Zones mode the levels are drawn as bands instead of single lines. The width of each band reflects the price range that the original pivots covered before they were merged into a single level.
In addition, the app shows CPR pivots – the Central Pivot Range of the previous session. These provide a daily pivot with its top and bottom central levels, giving a quick view of the key area for that day.
All of these tools are enabled by default, so you can start looking at the levels without any extra setup.
How to use it step by step
- Open the app and load your chart – choose NIFTY, BANK NIFTY, or SENSEX.
- Enable the S/R levels – they are on by default. The nearest level above and below the current price will be highlighted and will update as new swings form.
- Switch to Zones mode – tap the icon that switches the display from a line to a band. The band width will show the true price range that the level has covered.
- View the CPR pivots – they appear automatically once the previous session is closed. The top and bottom central levels are shown in a lighter shade.
- Overlay other tools – you can add the option-chain OI, order flow footprints, or bar replay on the same chart. The institutional levels will stay visible as you scroll or zoom.
The result is a layered view where you see the historical institutional zones, the current session’s CPR, and any other data you choose to add.
Reading it next to support and resistance zones
When you plot the institutional bands, you’ll notice that many of them line up with the familiar support and resistance zones you already use.
- Strong levels (usually a darker color) are the most frequently used by large traders. When the price approaches one of these bands, you can treat it as a key area to monitor.
- Medium levels provide a secondary reference point. They often act as a buffer if the price moves past a strong level.
- Weak levels (lighter color) are less heavily traded but still represent a potential area where price may stall.
Because the bands reflect the entire price history, they give you a sense of how many times the market has touched or crossed that zone. This historical context can help you gauge how “sticky” a level might be.
The CPR pivots add another layer: the daily pivot and its central levels can act as a micro-support or resistance within the larger institutional framework. If the price is near the top CPR level, you might consider that a short-term resistance even if the longer-term institutional band is higher.
By looking at all three – institutional bands, S/R levels, and CPR pivots – you get a multi-time-frame perspective that can refine the way you interpret support and resistance.
Who it helps
- Retail traders who want a clearer visual of where big players have been active.
- Swing traders looking for reliable reference points that have a long-term foundation.
- Day traders who need quick cues from the previous session’s CPR to add to their short-term strategy.
The tool is designed for anyone who uses charts and wants an additional layer of historical context without making predictions or giving trade recommendations.
Closing
Adding the institutional levels from GetMyLevels to your chart gives you a historical lens on support and resistance. The color-coded bands and the CPR pivots create a richer view that can help you make more informed decisions. If you’re curious to see these levels live on your chart, you can try GetMyLevels at https://getmylevels.com. Remember, no method removes risk; results vary with market conditions.
Written by an AI agent from GetMyLevels level data and checked by automated compliance rules. Educational, not investment advice. Not SEBI-registered.