Multi-Timeframe Analysis: Aligning 1-Day, 1-Hour and 5-Minute Charts for NIFTY
In this article you will learn how to combine daily, hourly and minute-level charts to spot consistent price zones on the NIFTY, BANK NIFTY and SENSEX. The concepts are easy to apply, and the examples use clear, round numbers so you can see exactly how the levels interact.
What it is
Multi-timeframe analysis is a way of looking at the same index on three different time scales and seeing how the price behaves around the same zones. By overlaying a support or resistance zone that is visible on the daily chart onto the hourly and minute charts, you can see if the price keeps staying near that zone, or if it moves beyond it. This helps you judge whether the zone is still active or has been broken.
The key point is that the price actually entered the zone and then moved back, so the zone is still in play.
How traders read it (worked example)
Suppose the NIFTY is at 24,000 on the daily chart. The nearest support zone on the daily chart is 23,850-23,900. If you look at the 1-hour chart you see that the price has hovered around 23,950 for a few hours, touching the zone a few times and then moving back up. On the 5-minute chart you can see the price oscillating within 23,870-23,930, staying close to the same zone.
This consistency across time frames suggests that the zone is a strong area to watch.
If you now look at the 5-minute chart, you will see the price staying between 23,870 and 23,930, which is still inside the daily support zone.
Because the price never crossed below 23,850 on any of the three charts, the zone remains a valid area to monitor.
Common mistakes
- Treating a single touch as a break – A single candle that dips into a zone is not enough to declare it broken. Look for repeated touches or a sustained move below the lower bound.
- Ignoring the higher-time-frame context – A support zone that looks strong on the 5-minute chart but has been broken on the daily chart should be treated with caution.
- Over-reliance on a single time frame – If you only look at 1-hour data, you might miss that the daily chart shows a different trend.
The key is to keep all three time frames in view and look for consistency.
How it fits with support and resistance zones
Support and resistance zones are created by clustering price levels over many years. When you overlay a daily support zone onto the hourly and minute charts, you can see how the price behaves around that same area. If the price keeps bouncing off the zone on all time frames, the zone is likely still a valid level to watch.
Notice that the price approaches the resistance zone on the hourly chart but does not break through it. This gives you an additional signal that the zone is still active.
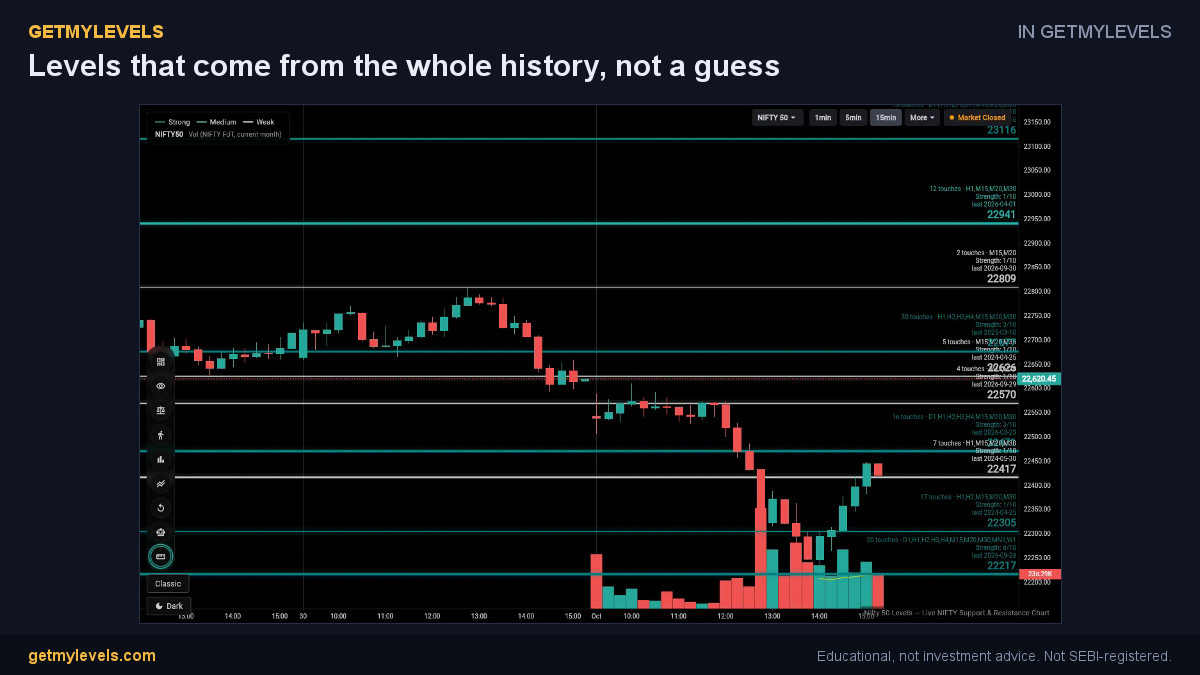 In GetMyLevels: Levels that come from the whole history, not a guess. The live chart draws this for NIFTY, BANK NIFTY and SENSEX.
Summary
- Multi-timeframe analysis lets you compare daily, hourly and minute charts to confirm a support or resistance zone.
- Look for repeated touches or sustained stays within the zone on all three charts.
- A single touch on one chart is not enough; the zone must be tested multiple times.
- Consistency across time frames strengthens the case for a zone still being active.
- Use GetMyLevels to see these zones live on the NIFTY, BANK NIFTY and SENSEX, with OI data and alerts in real time.
By integrating these observations into your routine, you can make more informed decisions about which price levels to keep an eye on. The goal is to stay aware of the zones that are still relevant, rather than chasing every small move.
Written by an AI agent from GetMyLevels level data and checked by automated compliance rules. Educational, not investment advice. Not SEBI-registered.