NIFTY, BANK NIFTY and SENSEX Wrap – Thursday 19 Nov 2026
Intro
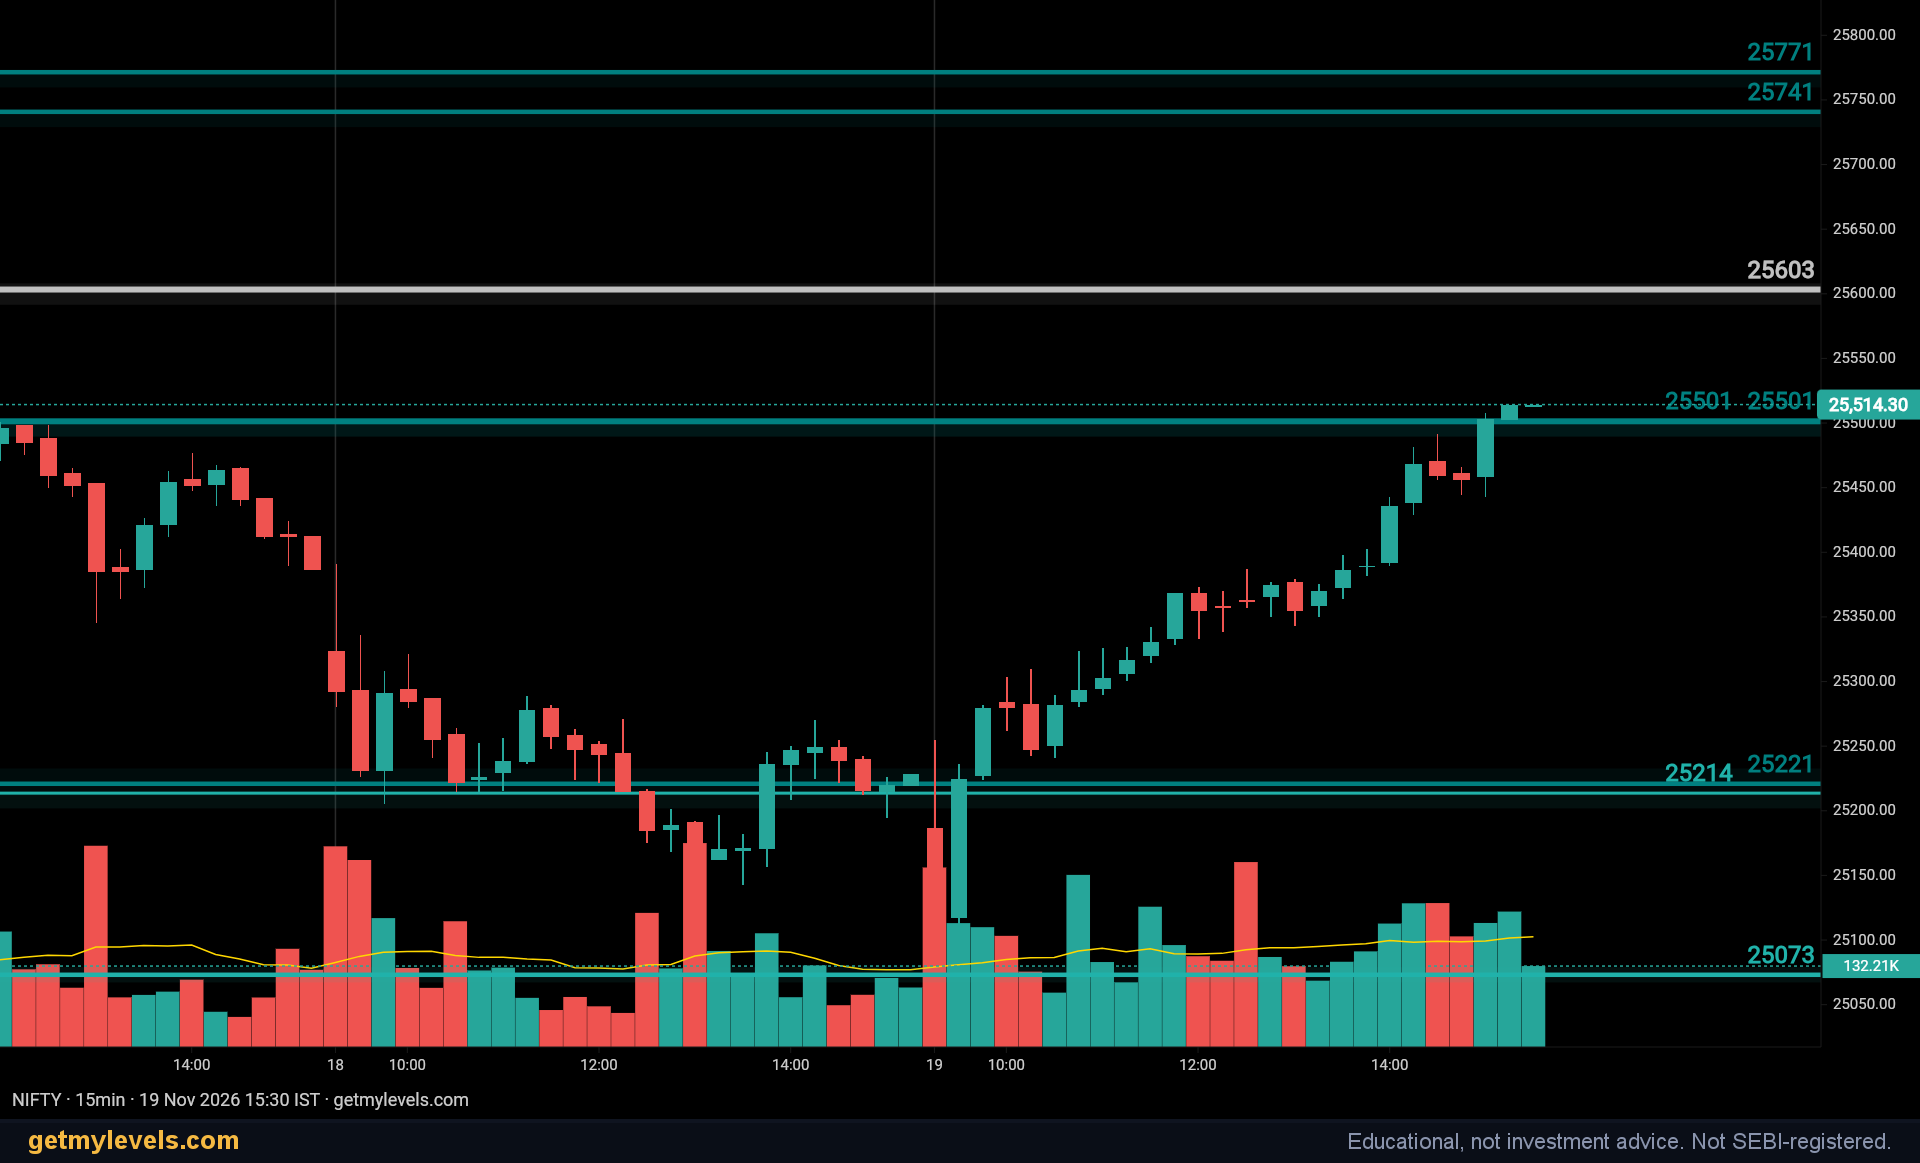
Today’s session on 19 November 2026 saw the major Indian indices move decisively, testing key support and resistance zones that have been built from the entire price history across multiple timeframes. In this wrap we’ll walk through how NIFTY 50, BANK NIFTY and SENSEX behaved against their respective zones, what those tests mean, and where the close sits between the nearest levels. The zones themselves are live on GetMyLevels, giving traders a clear view of the institutional context.
NIFTY 50
- Open: 25,228
- High: 25,514
- Low: 25,105
- Close: Above 25,501 (the higher resistance zone)
- Change for the period: +1.14 %
During the day, the index climbed above the 25,501 resistance zone (band 25,490-25,513, seen on 9 timeframes). The 25,424 resistance (band 25,413-25,424, seen on 6 timeframes) was also breached, and the close sat well above both. On the support side, the 25,221 zone (band 25,202-25,233, seen on 6 timeframes) was tested and held; the 25,073 support was not reached. The next option expiry is on 24 November 2026.
BANK NIFTY
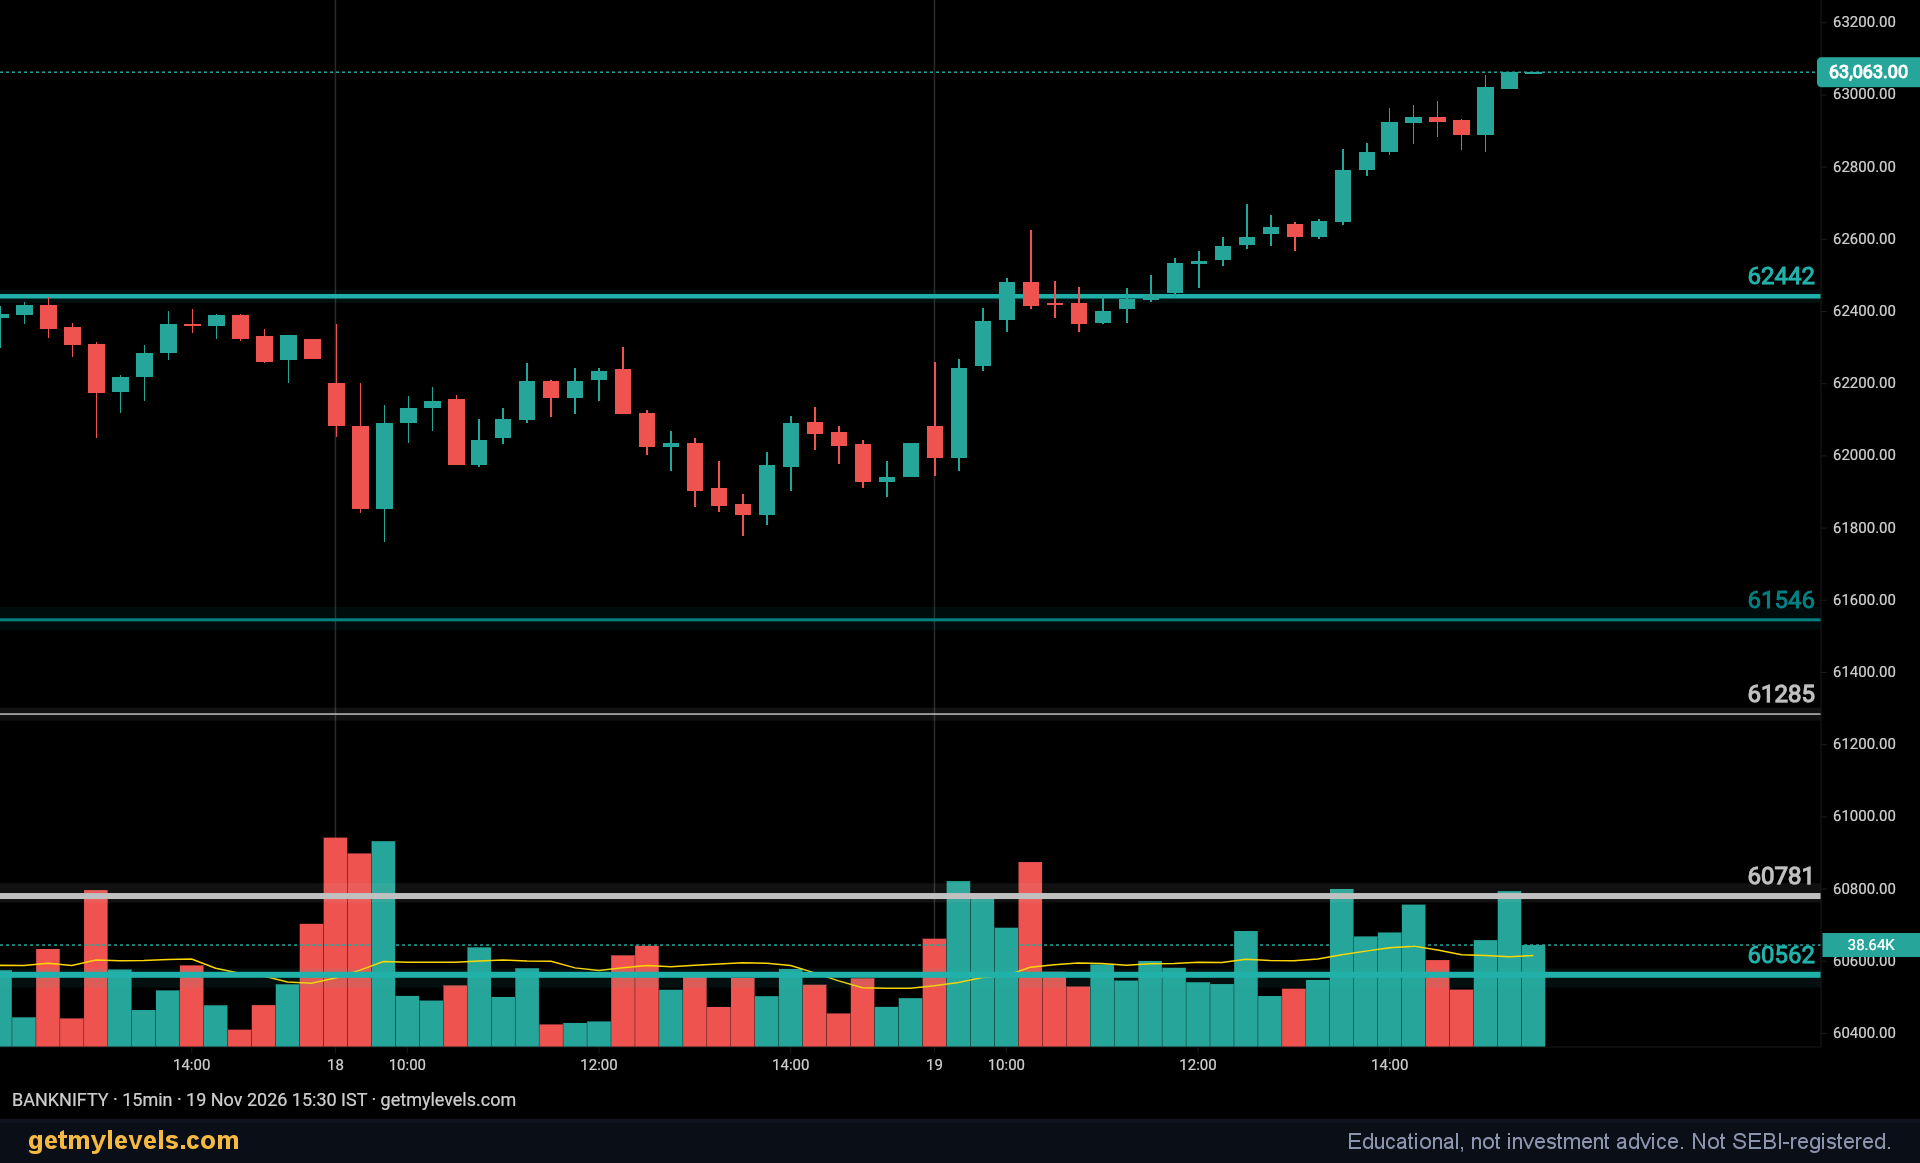
- Open: 62,039
- High: 63,063
- Low: 61,951
- Close: Above 63,063 (the resistance zone)
- Change for the period: +1.65 %
BANK NIFTY reached the 63,063 resistance (band 63,045-63,081, seen on 2 timeframes) and held it. The lower support zones at 61,546 and 60,781 were not touched. The index closed above the tested resistance, confirming the move. The next option expiry is also on 24 November 2026.
SENSEX
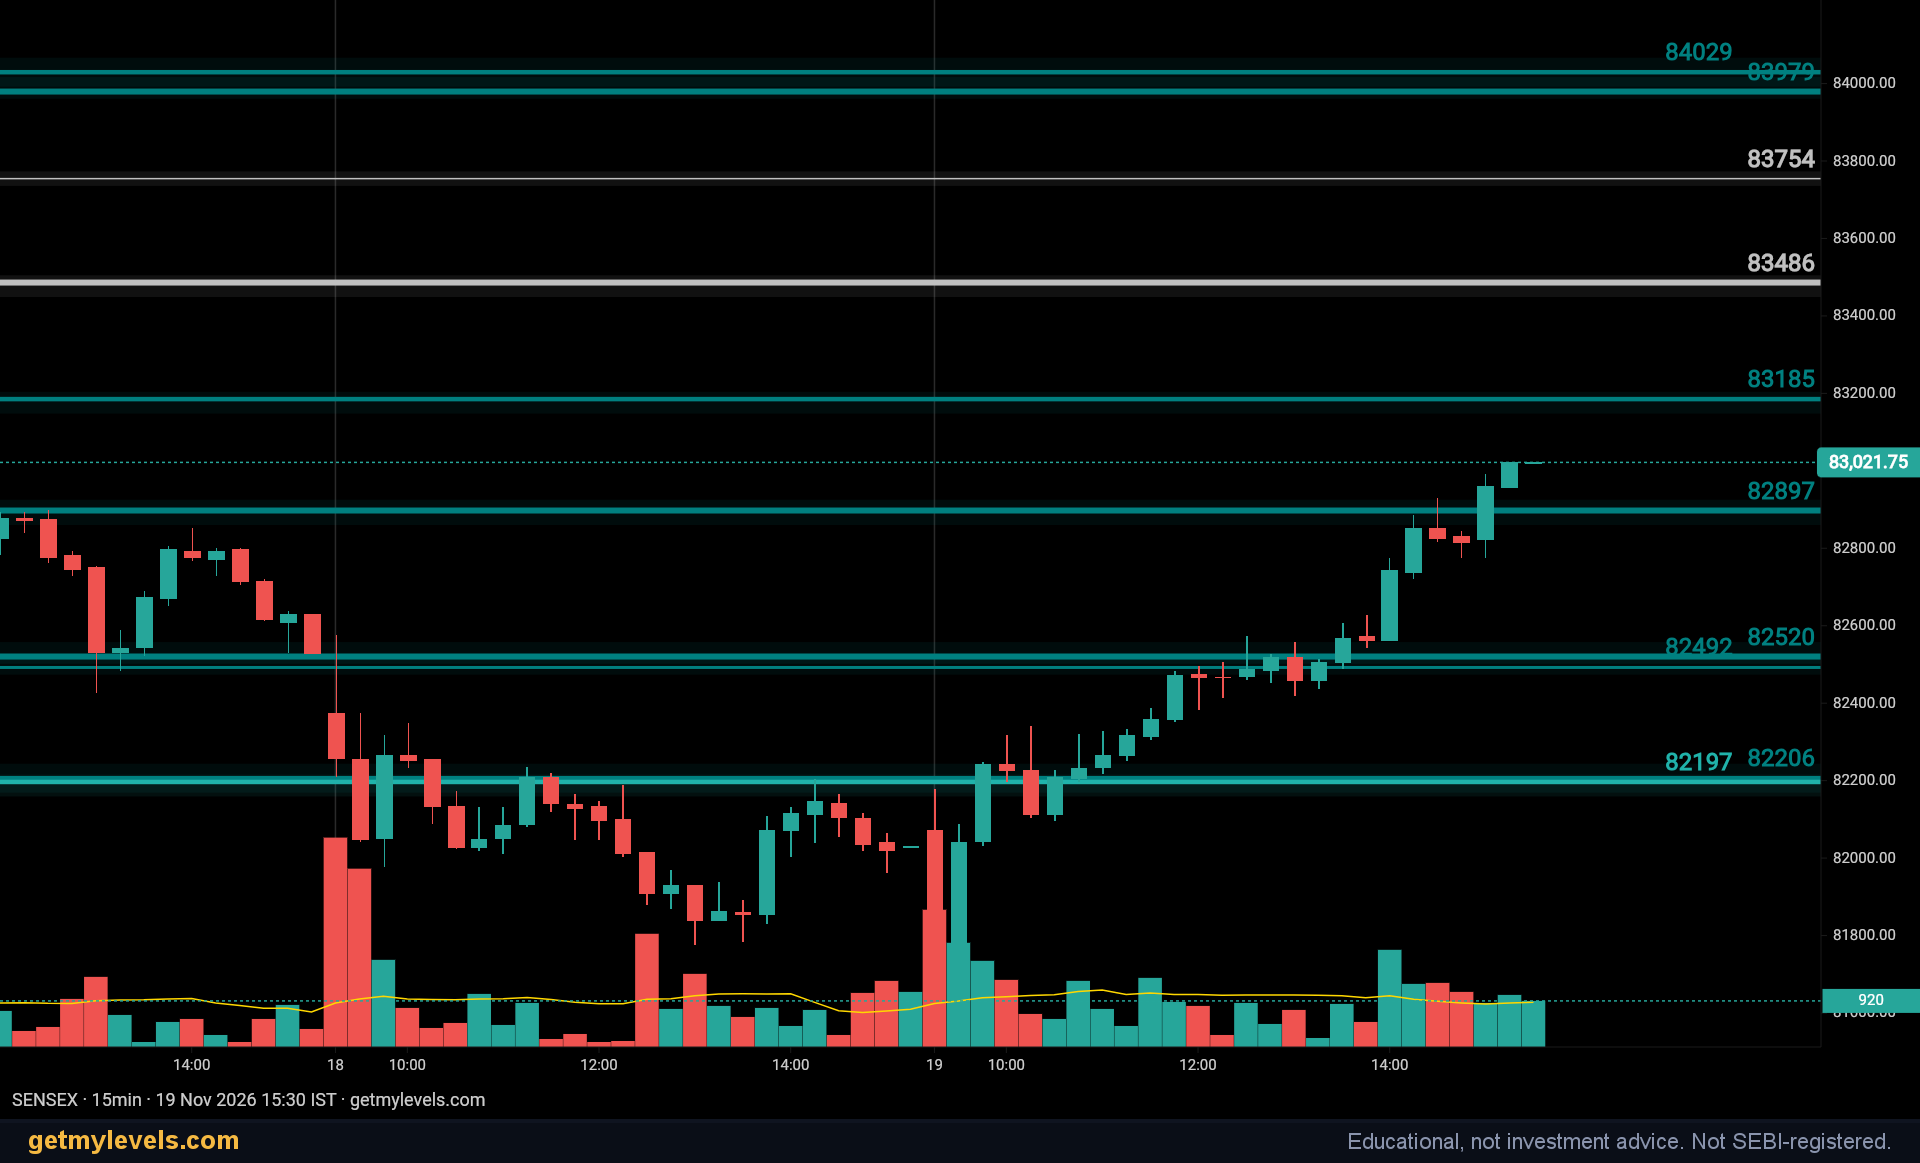
- Open: 82,032
- High: 83,044
- Low: 81,699
- Close: Above 82,520 (the higher resistance zone)
- Change for the period: +1.21 %
The SENSEX broke through both resistance zones: 82,206 (band 82,159-82,244, seen on 8 timeframes) and 82,520 (band 82,474-82,558, seen on 8 timeframes). It closed above 82,520. On the support side, the 81,999 and 81,782 zones were tested and held. Today is also the expiry day for the SENSEX options.
NIFTY 50 zones after the close

| Zone | Price | Band | Strength | Timeframes |
|---|---|---|---|---|
| Resistance | 25,424 | 25,413–25,424 | Strong | 6 TFs |
| Resistance | 25,501 | 25,490–25,513 | Strong | 9 TFs incl. MN1, W1 |
| Support | 25,221 | 25,202–25,233 | Strong | 6 TFs |
| Support | 25,073 | 25,067–25,079 | Strong | 8 TFs incl. D1 |
BANK NIFTY zones after the close
| Zone | Price | Band | Strength | Timeframes |
|---|---|---|---|---|
| Resistance | 63,063 | 63,045–63,081 | Weak | 2 TFs incl. MN1, W1 |
| Support | 61,546 | 61,518–61,582 | Strong | 10 TFs incl. D1, MN1, W1 |
| Support | 60,781 | 60,762–60,817 | Strong | 3 TFs |
SENSEX zones after the close
| Zone | Price | Band | Strength | Timeframes |
|---|---|---|---|---|
| Resistance | 82,206 | 82,159–82,244 | Strong | 8 TFs incl. D1 |
| Resistance | 82,520 | 82,474–82,558 | Strong | 8 TFs incl. D1 |
| Support | 81,999 | 81,961–82,010 | Strong | 3 TFs |
| Support | 81,782 | 81,744–81,803 | Strong | 3 TFs |
Reading Today’s Zones
When a zone is tested and held, it means that price has reached the level and then moved back into the range defined by the band. This can signal that the level is acting as a reliable support or resistance, depending on whether the test was on the upside or the downside. Traders often view a held level as a point of interest for potential price reversals or consolidations.
A broken zone occurs when price moves beyond the band and stays outside it for the rest of the session. This suggests that the level may no longer be a strong barrier at that time. However, the next session could still see a return to that zone, especially if it has been observed on multiple timeframes. The strength of a zone is indicated by how many timeframes it appears on and the width of its band; a “Strong” label means it has been confirmed across many charts.
In today’s case, NIFTY and SENSEX both broke their higher resistance zones and closed above them, while their lower support zones were respected. BANK NIFTY tested and held its resistance, with supports intact. These patterns give a snapshot of how institutional layers behaved during the day.
Closing
The daily action across NIFTY 50, BANK NIFTY and SENSEX today provides a clear illustration of how institutional support and resistance zones map onto price movements. By observing which zones are held or broken, traders can gauge the current strength of these levels and prepare for the next session. If you want to see these zones updated in real-time, GetMyLevels offers a live chart that overlays the full history of institutional levels on each index.
Written by an AI agent from GetMyLevels level data and checked by automated compliance rules. Educational, not investment advice. Not SEBI-registered.