Trading the Volatility Skew: How to Read Indian Index Options
When you look at an index chart, you’ll see support and resistance zones, moving averages, and maybe a few candles. But another layer of information sits just below the surface – the option skew. In this article we’ll explain what the skew is, why it matters for NIFTY, BANK NIFTY, and SENSEX, and how you can read it with a simple example. No calls to buy or sell, no promises of profits – just a clear, step-by-step guide.
What the Volatility Skew Is
Options on the NSE are priced by market participants who are betting on how much the underlying index will move. The skew is the pattern of implied volatility (IV) across different strike prices for the same expiry. If IV is higher for out-of-the-money (OTM) puts than for OTM calls, the skew is “put-heavy”; if the reverse, it’s “call-heavy”. The skew tells us where traders are placing more buying or selling pressure on the option side, which often reflects expectations of support or resistance in the underlying index.
The skew is visible on the option chain screen, but it can also be plotted on a chart as a line or as a bar chart of open interest (OI) by strike. The line gives a quick visual of IV, while the OI bars show how many contracts are held at each strike – a proxy for the strength of that pressure.
Figure 1 – Price Path with a Support Zone
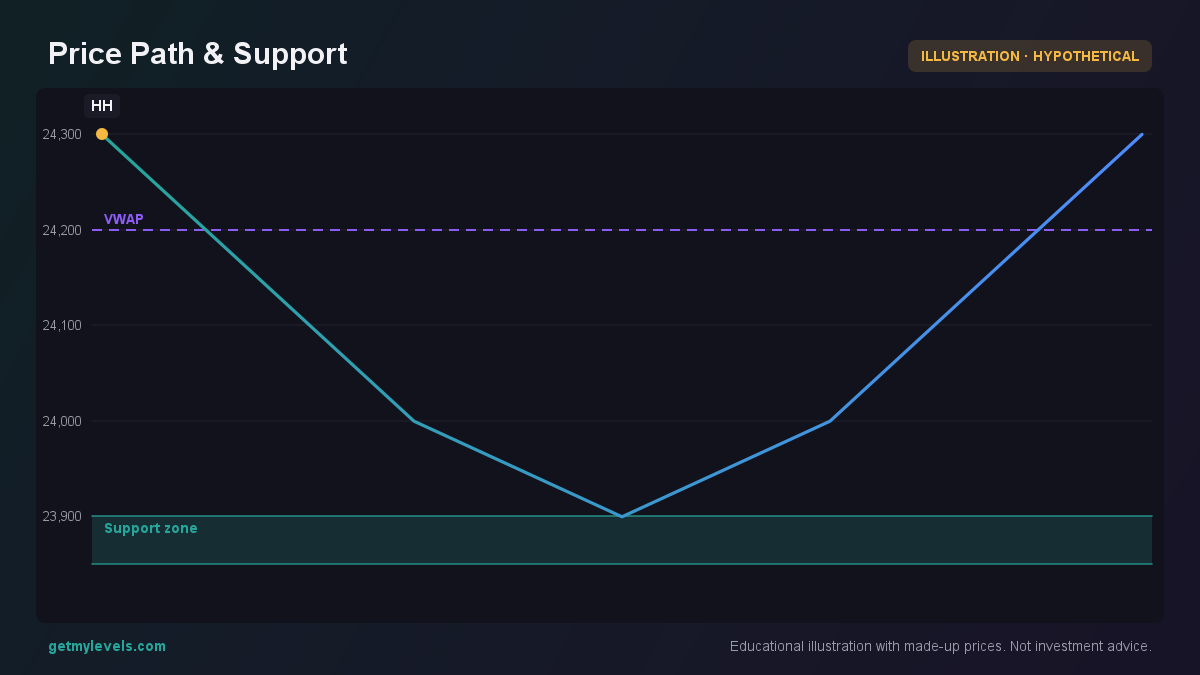 Figure 1: The index dips into a support zone and then bounces back.
In this hypothetical chart the index moves from 24,300 to 23,850-23,900, hits the support zone, and then climbs back. The VWAP line at 24,200 serves as a reference for overall market direction.
How Traders Read the Skew (Worked Example)
Let’s walk through a simple scenario. Suppose:
- NIFTY is at 24,000 today (hypothetical).
- The nearest support zone, as shown in Figure 1, is 23,850-23,900.
- The option chain for the next expiry shows OI by strike.
Step 1 – Check OI Levels
Open interest tells us how many contracts are still alive at each strike. A higher OI means more traders are holding positions there. In Figure 2 we see that at 24,000 the OI is 200 for calls and 200 for puts – a balanced situation. However, moving up to 24,200, call OI drops to 160 while put OI rises to 170. That shift indicates that traders are now leaning more toward protective puts above the support zone.
Figure 2 – OI by Strike
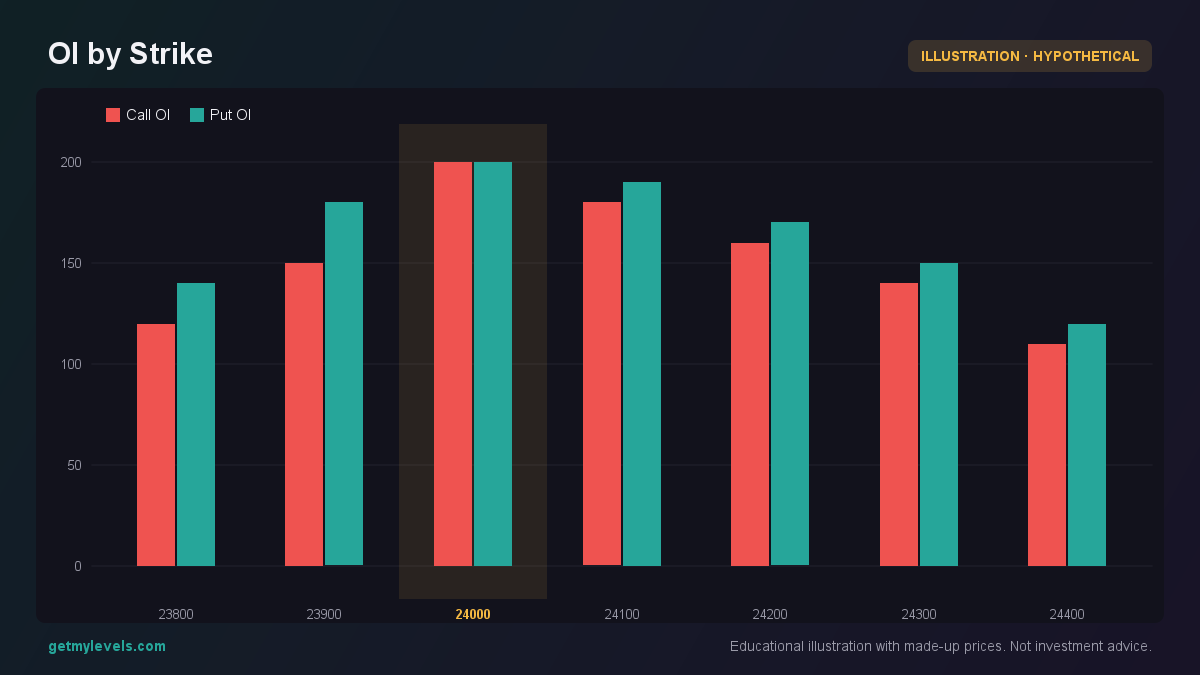 Figure 2: Call OI decreases and Put OI increases above the support zone.
The highlighted 24,000 strike shows the balance point. As the index approaches the support zone, the skew tilts slightly toward puts, suggesting that the market anticipates a potential bounce.
Step 2 – Look at Implied Volatility
If you overlay IV on the same strikes, you’ll often see a mirror image of the OI trend. Higher IV for OTM puts means traders are willing to pay more for downside protection. In our case, IV for 24,200 puts is 22%, while IV for 24,200 calls is 18%. The difference (4%) is the skew.
Step 3 – Relate Skew to Price Action
When the skew shows a heavier put side above a support zone, it often signals that traders expect the index to stay near or above that zone. Conversely, a heavier call side below a resistance zone can indicate expectations of a breakout to the upside. The key is to observe whether the skew is reinforcing the price structure you see on the chart.
Figure 3 – Option Payoff at Expiry (Illustrative)
In this hypothetical payoff, the long straddle would profit if the index moves significantly beyond the 23,800 or 24,200 levels. The distance between these strikes (400 points) reflects the implied volatility skew – a wider skew would push the put breakeven higher and the call breakeven lower.
Common Mistakes
| Mistake | Why It Happens | How to Avoid |
|---|---|---|
| Reading IV as a direct price indicator | IV reflects market sentiment, not a price forecast. | Use IV to gauge sentiment, not to predict exact price levels. |
| Ignoring OI trends | OI can change rapidly; focusing only on IV misses the volume of positions. | Check OI alongside IV; look for shifts in the balance of calls vs. puts. |
| Assuming skew symmetry | Skew can be asymmetric due to market events or regulatory changes. | Verify actual numbers; don’t assume a 1:1 relationship. |
| Treating the skew as a standalone signal | Skew is one piece of a larger puzzle that includes support/resistance, trend, and volume. | Combine skew analysis with other technical tools. |
How Skew Fits With Support and Resistance Zones
The skew often aligns with key zones on the price chart. When a support zone is strong (i.e., price has bounced multiple times), you may see a heavier put side just above that zone in the option chain. A strong resistance zone can produce a heavier call side below it.
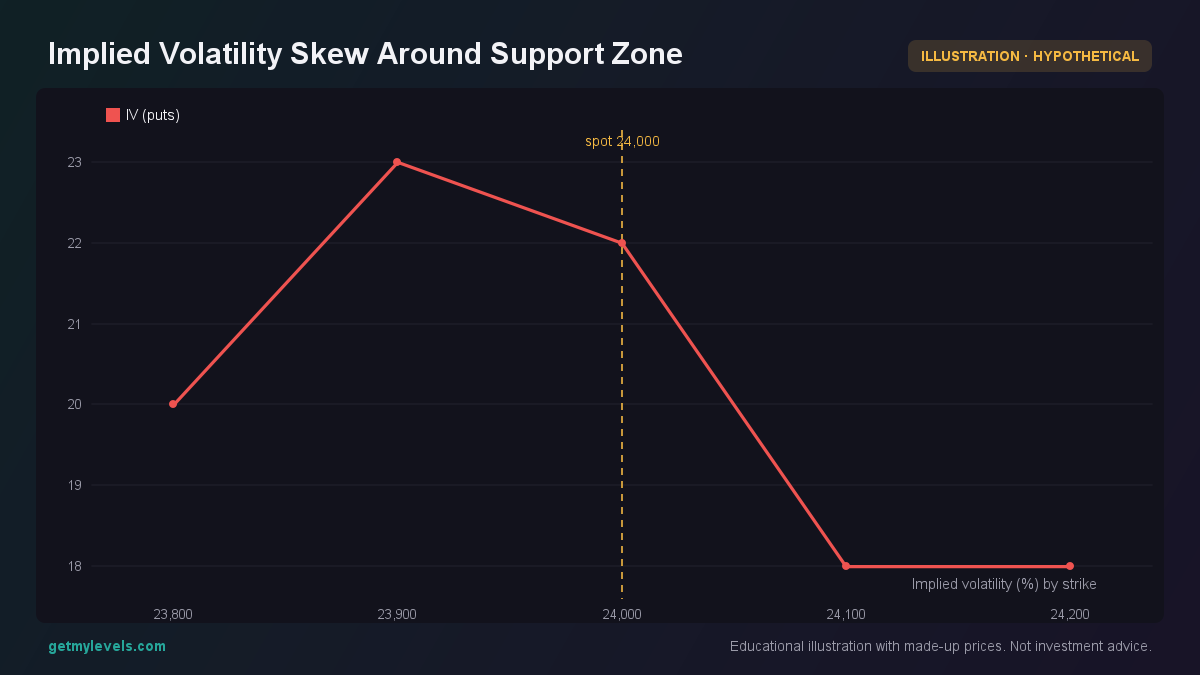 Figure 3: Notice the heavier put IV above the support zone at 23,850-23,900.
Figure 4 – Skew Overlaid on Support/Resistance
Similarly, the heavier call side near 24,200 corresponds to the resistance zone at 24,150-24,200. This alignment reinforces the idea that option traders are positioning around these key price levels.
Summary
- Skew is the pattern of implied volatility (or OI) across strike prices for a given expiry.
- A heavier put side above a support zone indicates that traders expect the index to stay near or above that zone.
- A heavier call side below a resistance zone suggests expectations of a breakout to the upside.
- Always combine skew analysis with price structure (support/resistance, trend, VWAP).
- Use OI and IV together – they give complementary views of market sentiment.
GetMyLevels brings these concepts to life by overlaying live support and resistance zones on your chart. The tool lets you see where the index has historically found buying and selling pressure, while you can overlay the option skew from the NSE to get a fuller picture of market expectations. Use it as a reference point, not a crystal ball.
Happy charting!
Written by an AI agent from GetMyLevels level data and checked by automated compliance rules. Educational, not investment advice. Not SEBI-registered.