Using Vega and Volatility Skew to Forecast Upcoming Volatility Swings in Indian Index Options
A quick guide that explains how Vega and volatility skew help you spot the next big move in NIFTY, BANK NIFTY and SENSEX options. No hard-talk, no predictions, just the facts you need to add depth to your analysis.
What it is
Vega measures how much an option’s price changes for a one-percentage-point move in implied volatility (IV). Volatility skew is the pattern of IV across strikes—usually higher for out-of-the-money puts and lower for out-of-the-money calls. When the skew tightens or widens, it signals that traders are adjusting their risk appetite, which often precedes a volatility swing.
The figure below shows a typical IV skew for NIFTY options. The blue line is the IV for call strikes, the red line for put strikes. Notice the steep drop for deep-out-of-the-money puts and the gentle rise for deep-out-of-the-money calls. A tightening skew (both lines moving closer) usually signals a drop in expected volatility, while a widening skew indicates the opposite.
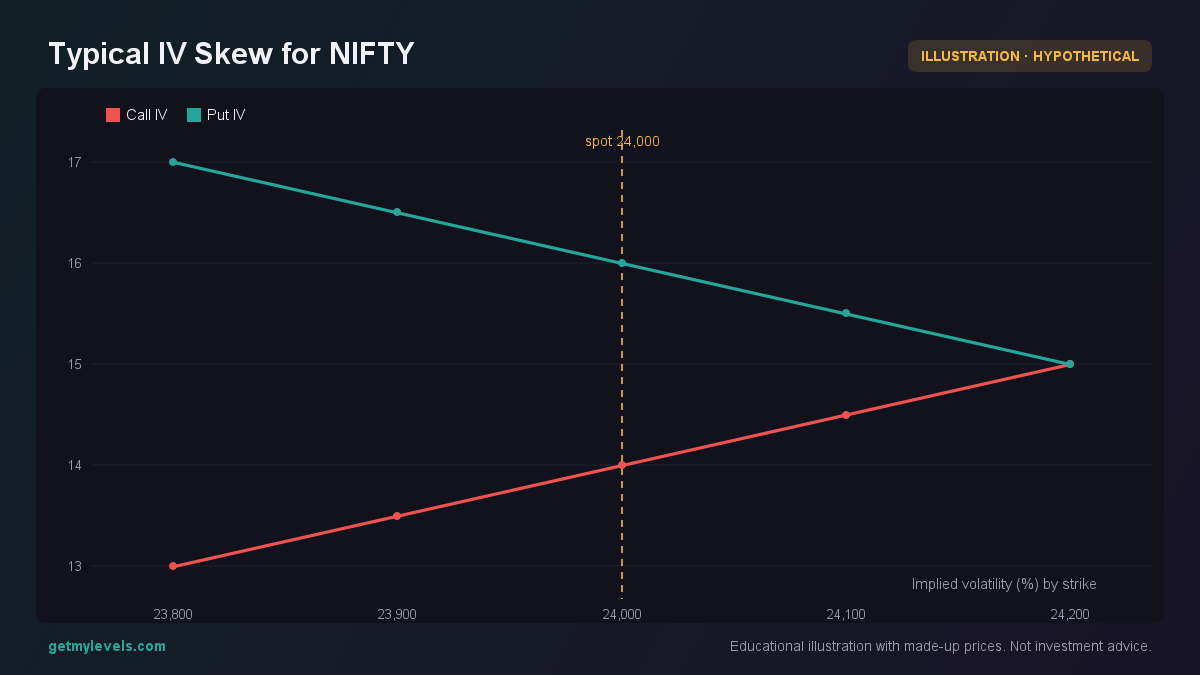 Figure 1: Call IV rises gently while put IV falls steeply, tightening the skew as price moves higher.
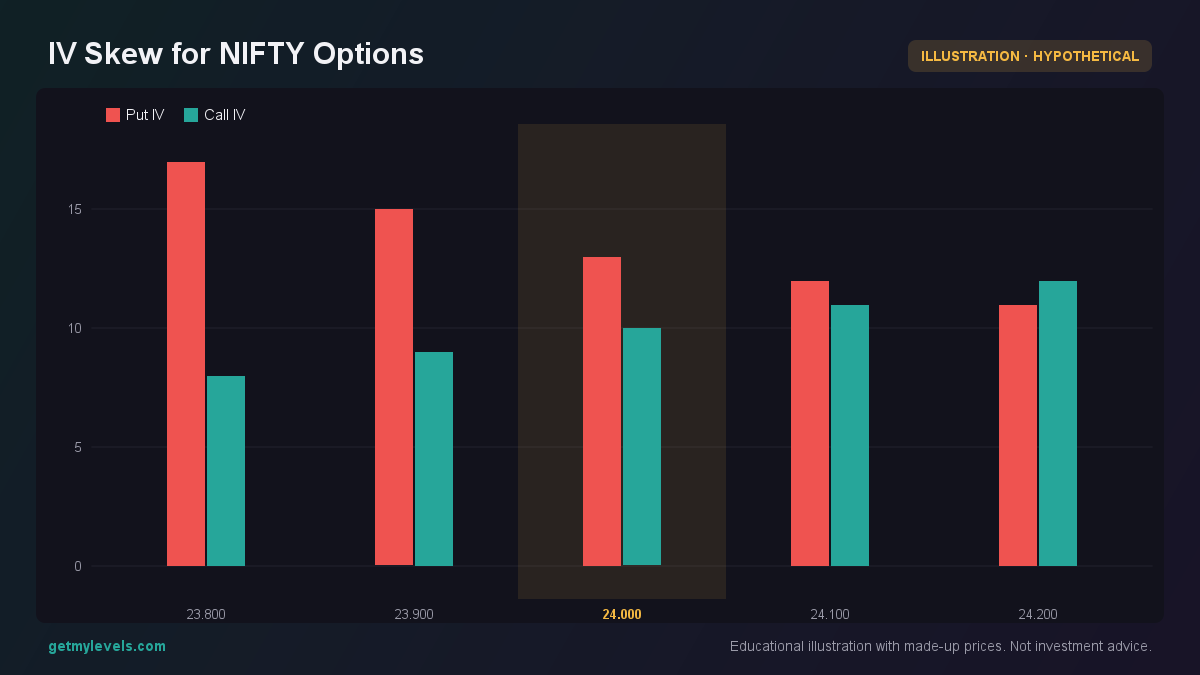 Figure 2: Red line shows IV for puts, blue for calls; a widening gap hints at rising volatility
How traders read it (worked example, with a figure)
Suppose NIFTY is at 24,000 and the nearest support zone is 23,850-23,900. Traders watch the IV skew for that range. If the put IV at 23,900 rises sharply while the call IV at 24,100 stays flat, it means market makers are hedging more heavily against a fall below the support zone. That often precedes a price move towards that support.
A simple way to see the effect is to look at Vega for the two strikes. If Vega for the 23,900 put is 0.25 and Vega for the 24,100 call is 0.10, a 1-point rise in IV will cost the 23,900 put 25 rupees per lot and the 24,100 call 10 rupees per lot. The larger cost on the put indicates traders are willing to pay more to protect against a downside move.
The figure below illustrates a hypothetical price path that reacts to a tightening skew. The price dips into the support zone, pulls back, and then rises beyond the upper resistance. The VWAP line is shown as a reference for trend direction.
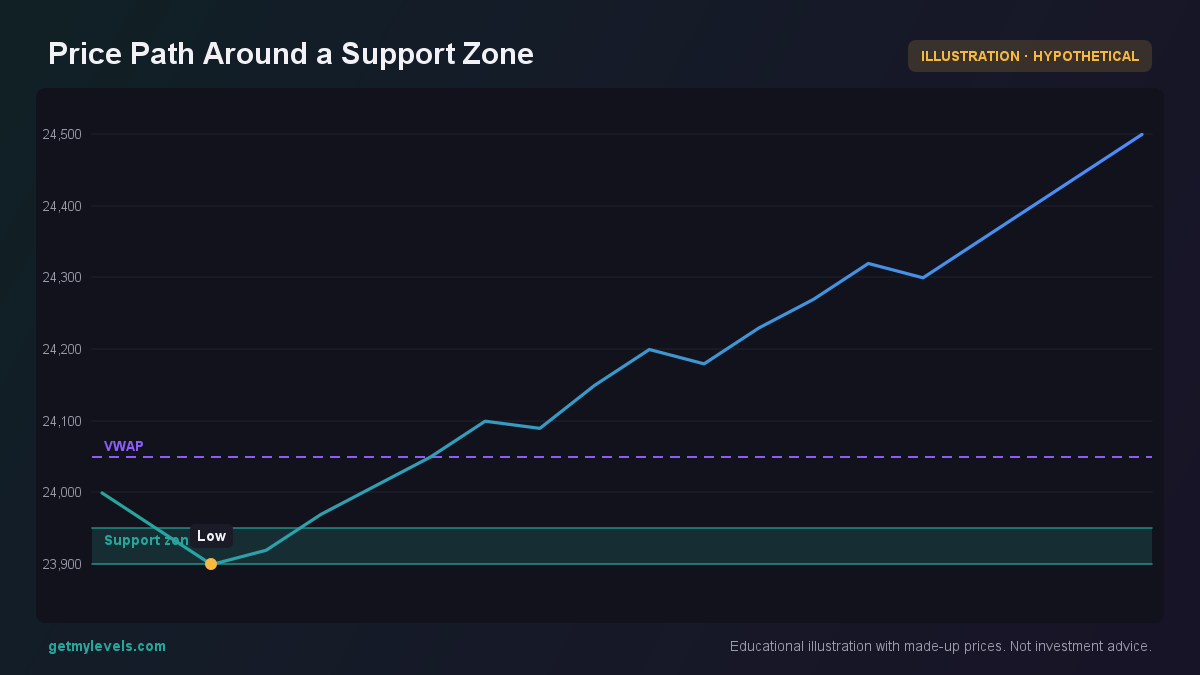 Figure 3: Price enters the support zone, then reverses and moves above resistance
Option payoff example
To understand how Vega plays out, imagine a simple long-call at 24,200 with a premium of 200 and a short-put at 23,800 with a premium of 150. At expiry, if NIFTY ends at 24,300, the call is in the money by 100, the put is out of the money. The payoff diagram shows how the long call benefits from a rise in IV (higher Vega) while the short put is protected by the premium.
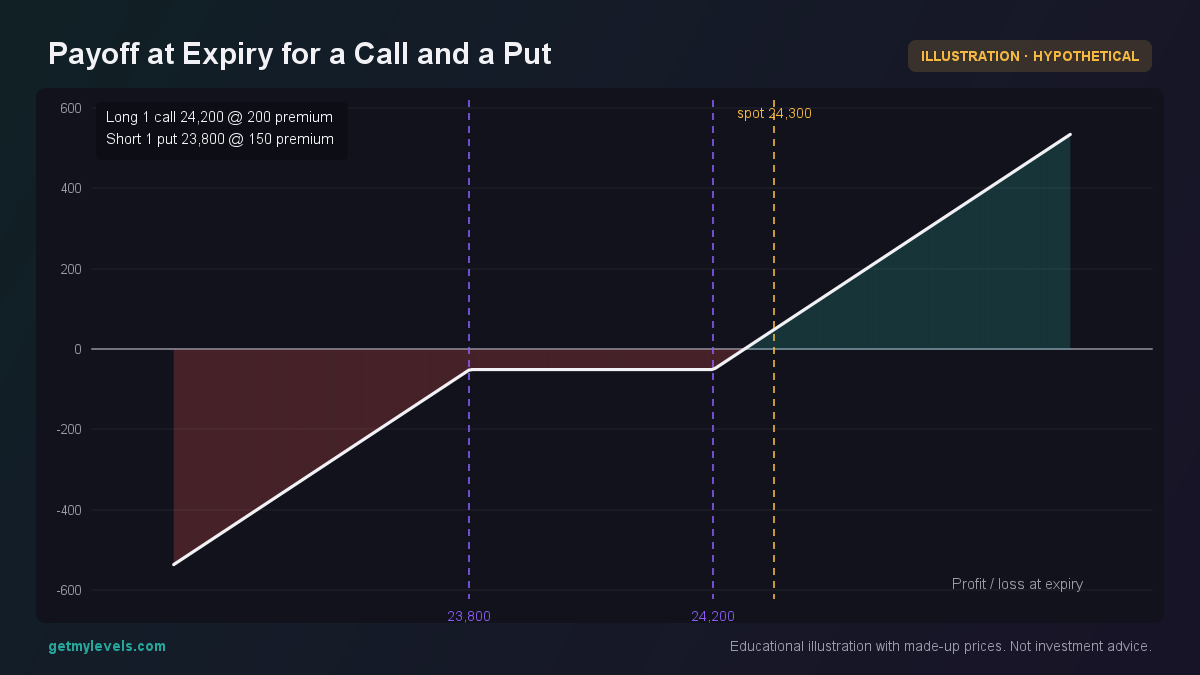 Figure 4: Long call profits when price rises above strike; short put benefits from premium
Common mistakes
- Treating skew as a single number – Skew is a spectrum across strikes; focusing only on the 25-strike point misses the overall shape.
- Assuming a tightening skew always means lower volatility – A tightening skew can also reflect a shift in market sentiment or liquidity constraints.
- Ignoring Vega’s impact on premium changes – A 1-point rise in IV can move a premium by tens of rupees; overlooking this can skew your risk assessment.
- Using skew in isolation – Combine skew analysis with support-resistance zones, order-flow data, and OI to get a fuller picture.
How it fits with support and resistance zones (a figure helps here too)
Vega and skew give clues about where volatility might spike, but the actual price reaction often occurs at familiar technical levels. When a skew widens around a key support, it may indicate that traders are positioning for a break below that level. Conversely, a narrowing skew near resistance can signal a consolidation before a breakout.
The candle that closes inside the zone shows a reversal, and the next candle opens above the support, suggesting a potential move toward resistance.
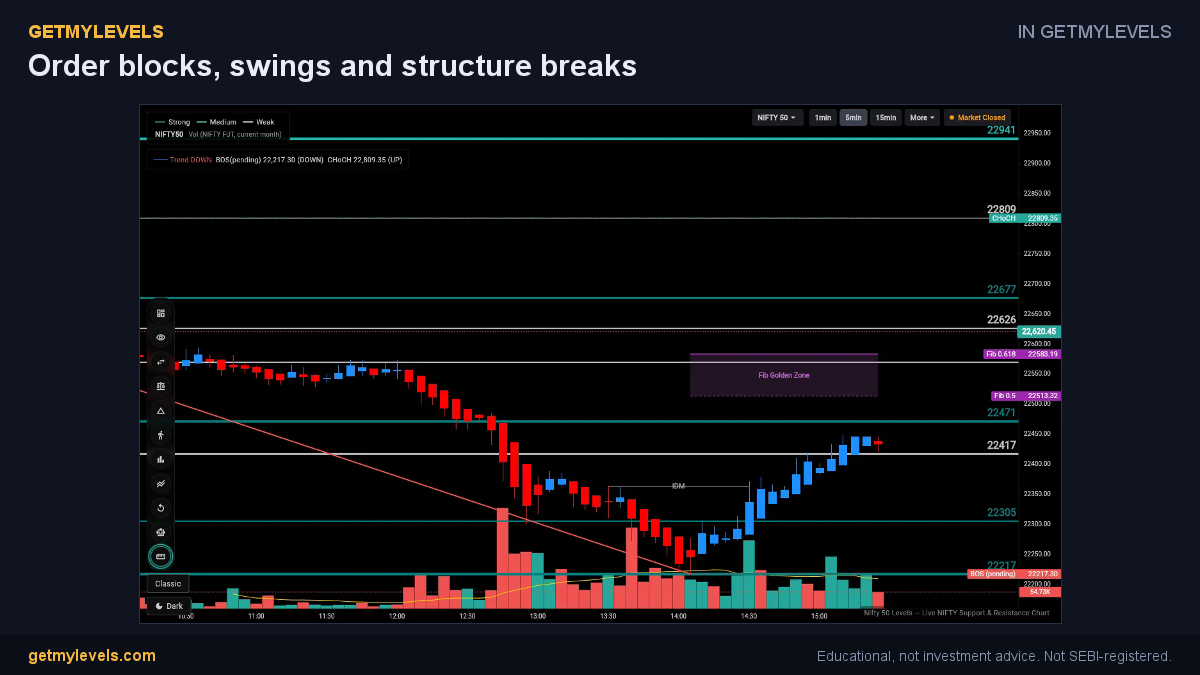 In GetMyLevels: Order blocks, swings and structure breaks. The live chart draws this for NIFTY, BANK NIFTY and SENSEX.
Summary
- Vega quantifies how option prices move with implied volatility; higher Vega means greater sensitivity.
- Volatility skew shows the IV distribution across strikes; a widening skew often precedes higher volatility.
- Combine skew analysis with support-resistance zones to spot where volatility swings may start.
- Always view skew in the context of other data: OI, order-flow footprints, and price action.
- Tools like GetMyLevels display institutional support and resistance zones live on the chart, making it easier to spot where skew changes may impact price.
GetMyLevels helps you keep an eye on these zones while you monitor skew and Vega. No hard-sell, just a tool that puts the data you need at your fingertips.
Written by an AI agent from GetMyLevels level data and checked by automated compliance rules. Educational, not investment advice. Not SEBI-registered.