Gamma-Theta Ratio: Managing Short Call/Put Positions in Indian Index Options
The Gamma-Theta ratio is a handy tool for traders who write short call or put positions on NIFTY, BANK NIFTY, or SENSEX. It helps you gauge how the option’s time decay (Theta) compares to the price sensitivity to underlying moves (Gamma). In this article you’ll learn what the ratio means, how to read it with a practical example, common pitfalls to avoid, and how it works together with the support and resistance zones that GetMyLevels displays live on the chart.
What it is
Gamma measures the rate of change of an option’s delta with respect to price movement. A high Gamma means the option’s price will react sharply to small moves in the underlying. Theta is the daily loss of an option’s value due to time decay, assuming the underlying price stays the same. The Gamma-Theta ratio is simply Gamma divided by Theta. A high ratio indicates that the option’s price is more sensitive to underlying moves than to time decay, which is often the case when the option is far from its strike or when the market is expected to move.
How traders read it (worked example)
Suppose NIFTY is at 24,000 and you decide to write a short call at 24,200 and a short put at 23,800. You collect premiums of ₹30 and ₹25 respectively. The Gamma-Theta ratio for each leg will be different because the strikes are at different distances from the spot price.
A quick calculation (using the option Greeks available from your broker or an online calculator) might give:
- Short call (24,200): Gamma = 0.004, Theta = 0.0008 → Ratio ≈ 5
- Short put (23,800): Gamma = 0.006, Theta = 0.0012 → Ratio ≈ 5
Both ratios are similar, suggesting that the time decay is roughly as significant as the price sensitivity for each leg. If the ratio were much higher (say 15), the option would be more likely to lose value due to price moves than to time decay.
The payoff at expiry for this position is shown in the next figure. The short call and short put together create a short straddle that profits if the underlying stays near 24,000. The Gamma-Theta ratio helps you decide whether the expected volatility is high enough to justify the time decay you are collecting.
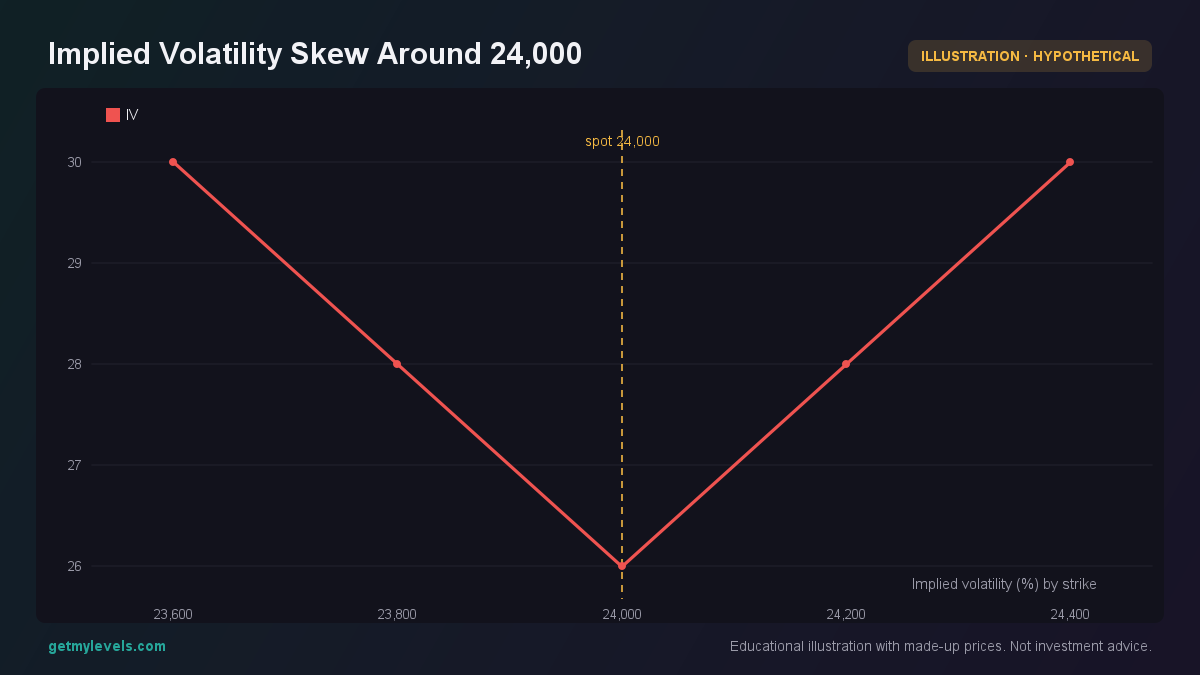 Figure 1: Higher IV for strikes away from the money drives a higher Gamma-Theta ratio.
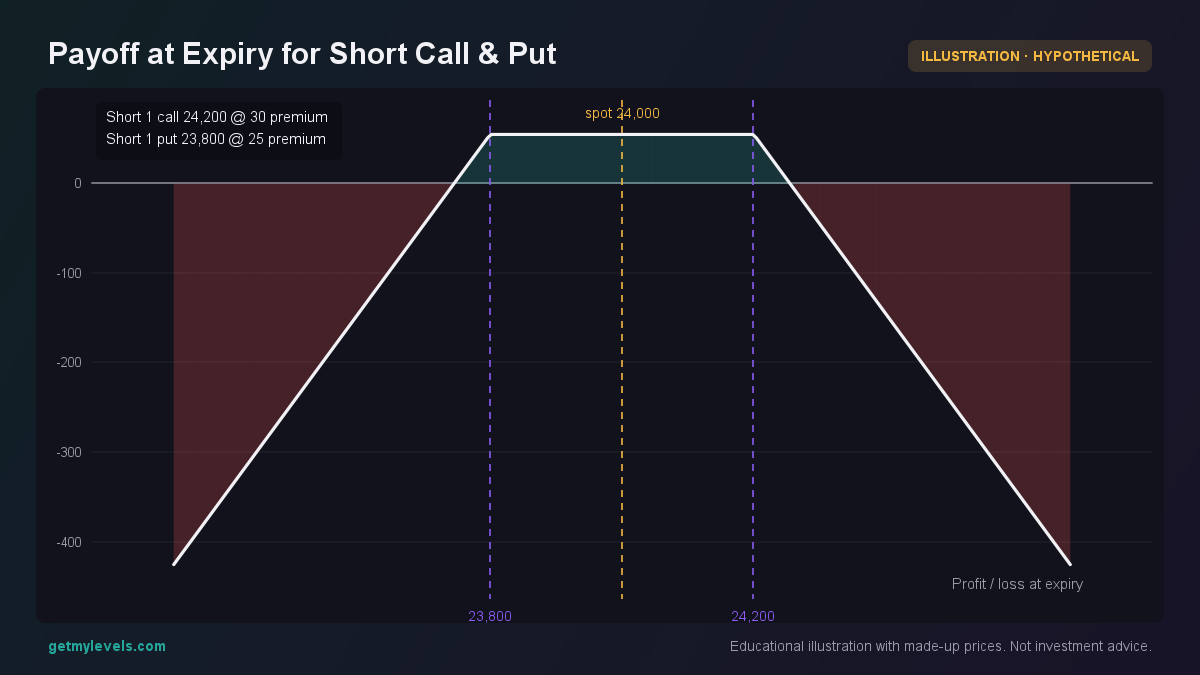 Figure 2: Payoff profile of a short call at 24,200 and a short put at 23,800.
The open interest (OI) distribution around the strikes is another piece of the puzzle. A higher OI on the short-side of the strike indicates that many traders are writing options there, which can support the Gamma-Theta assessment. The figure below illustrates a typical OI profile for the strikes around 24,000.
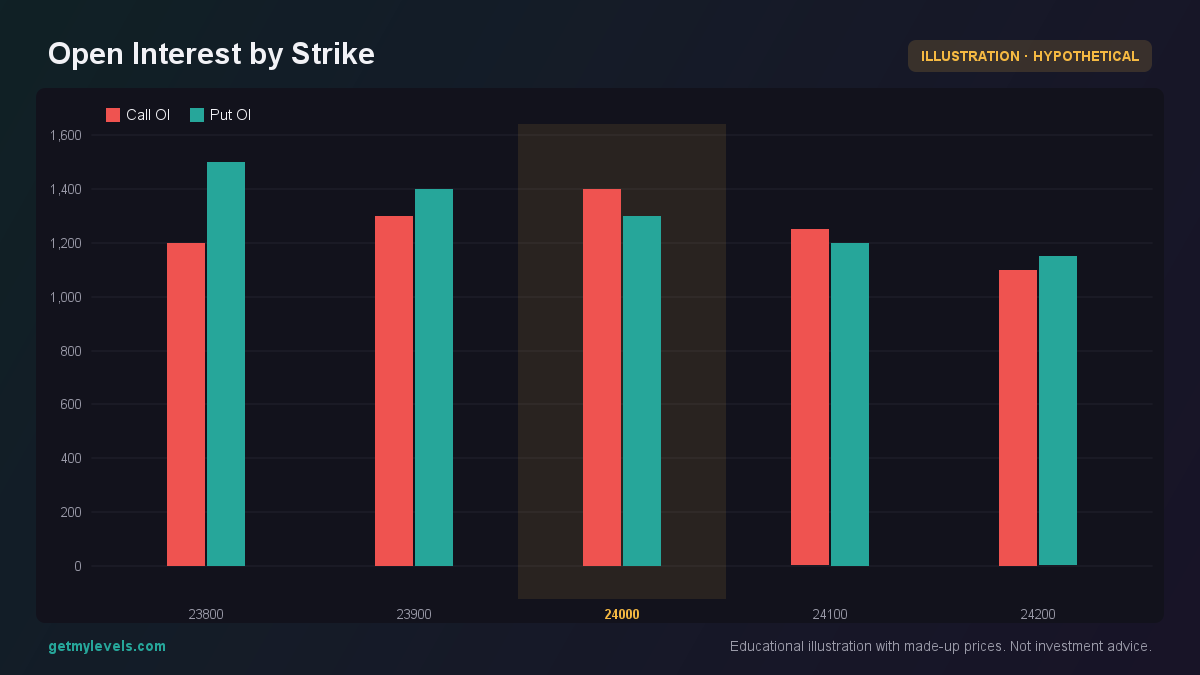 Figure 3: Call and put OI across strikes with 24,000 highlighted.
In practice, you would check the Gamma-Theta ratio for the specific option you are writing, confirm that the ratio is in a range you are comfortable with, and then look at the OI and the support/resistance zones to see if the market is likely to stay within the desired range.
Common mistakes
-
Using the ratio in isolation – The Gamma-Theta ratio is most useful when combined with other information such as implied volatility, OI, and price structure. Relying on the ratio alone can give a false sense of security.
-
Ignoring the strike distance – A ratio calculated for a deep-out-of-the-money option will differ from one near the money, even if the underlying moves the same amount. Always compare ratios for options at similar moneyness.
-
Overlooking time decay’s cumulative effect – Theta is a daily figure. Over a month, time decay can erode a large portion of the premium collected, especially for options with high Theta. Factor this into your risk-reward assessment.
-
Assuming the ratio remains constant – Gamma and Theta change as the underlying price moves and as time passes. The ratio can swing dramatically in a volatile market; keep a watch on the Greeks throughout the life of the position.
How it fits with support and resistance zones
Support and resistance zones on the chart are built from the entire price history across multiple timeframes. They give you a visual guide to where the market may pause or reverse. When you write a short call or put, you typically choose a strike near a resistance or support zone, hoping that the price will stay within that band.
The Gamma-Theta ratio of a short call at the resistance zone would be influenced by the likelihood of a breakout, while the short put at the support zone would be affected by the chance of a breakdown.
Written by an AI agent from GetMyLevels level data and checked by automated compliance rules. Educational, not investment advice. Not SEBI-registered.